
CCEPAS: the creation and validation of a fast and sensitive clinical whole exome analysis pipeline based on gene and variant ranking
 0
0Abstract
Aim: Whole exome sequencing technology has permitted the discovery of genes that cause Mendelian disorders and was used in clinical laboratories. However, identifying the disease causing variant(s) for a specific disorder from thousands of variants is challenging. In this study, we describe the Cincinnati Clinical Exome Pipeline Analysis Suite (CCEPAS) that utilizes a four-level framework into one analysis procedure that rapidly identify the most likely causative gene variants to establish a clinical diagnosis.
Methods: We developed and validated CCEPAS using 100 clinical exome cases. We applied this pipeline to clinical cases by first translating phenotypic information into candidate gene lists using Pheno2Gene. This list of candidate genes was given to the VarEval algorithm to guide variant filtering and prioritization. Finally, a short list of filtered variants was produced for clinical interpretation.
Results: We demonstrated the development and implementation of CCEPAS to aid in the variant prioritization and filtering to produce a short list of candidate variants for clinical diagnosis. Its unique Pheno2Gene tool utilized an extensive list of resources and provided an accurate, sensitive and specific way to obtain gene lists from clinical feature keywords. In addition, VarEval narrowed down the variants from ~150,000 to the top 20 (trios) and top 50 (singleton) for further variant curation and candidate determination.
Conclusion: Significantly, employment of CCEPAS rapidly provided causative variants in the top 20 and top 50 variants for single and trio cases, respectively, thus, ending the diagnostic odyssey in more than 30% of our clinical exome cases.
Keywords
Introduction
Identification of genes, and their corresponding mutations, responsible for rare monogenic disorders in humans, needs further attention since such discoveries continuously shed light on disease mechanisms[1-5]. Recent advances in exome sequencing technologies have allowed the discovery of genes that cause Mendelian disorders in a more comprehensive way by scanning the protein coding exome sequence space[6,7]. The utility of whole exome sequencing (WES) to identify variants causative of Mendelian disorders has been clearly demonstrated in identifying novel candidate genes for numerous genetic disorders[2,8-14]. However, identifying the causal mutation(s) for a specific Mendelian disorder from thousands of variants is a difficult undertaking[15]. Thus, the analysis is laborious, challenging, and costly even though the price of exome sequencing has continued to decline dramatically[16].
Variant filtering strategies based on statistical genetics, predicted degree of deleteriousness and comprehensive annotation have been employed to narrow down the list of candidate variants. For example, statistical genetics methods which prioritize genomic regions based on identity-by-decent polymorphisms and/or genetic linkage co-segregation include BEAGLE, GERMLINE, PLINK IBD and MERLIN[17-19]. Alternative methods focus on deleterious predictions of a non-synonymous single nucleotide variant in a protein-coding gene by using computational algorithms based on amino acid physicochemical properties, protein structure and cross-species conservation, namely, SIFT, Polyphen2, LRT, Grantham scale, Mutation Taster and PhyloP[20-26]. The third type of analysis approach, utilized by SeattleSeq, ANNOVAR and Alamut, comprehensively annotates variants using information from bioinformatics resources which are then used to prioritize variants[27]. Typically, functional information is found scattered across various tools and resources and may include inconsistent functional site predictions, making it challenging to get a list of candidate genes and their respective variants for follow-up experimental validation[24]. Furthermore, other important resources have yet to be incorporated into existing methods such as biological pathways and peer-reviewed literature.
Currently, clinical exome analysis groups have reported various filtering strategies. To identify the causative gene variant(s), the filtering algorithms for exome analysis pipelines are based on population and molecular genetic principles, namely, minor allele frequency (MAF) from public databases, examination of coding regions ± 2 bp, alterations present in the Online Mendelian Inheritance in Man (OMIM) and/or Human Gene Mutation Database (HGMD), inheritance modeling or co-segregation, in silico predictions, and phenotypic overlap among the proband and reported patients[28-30]. After the application of these filters, there are still 300-700 variants that need to be examined, thus, a ranking system that allows for the most likely causative gene variant to appear at the top of the list will aid the process with potential of data analysis time. Furthermore, genes that overlap with the clinical features are essential for exome analysis. Current clinical laboratories have reported the utilization of OMIM, HGMD and Human Phenotype Ontology (HPO) to provide the phenotype to genotype associations[28,31]. These searches may miss certain gene to phenotype associations due to the lack of frequent updates, synonymous word challenges and the lack of comprehensive search engines. However, new computational algorithms are necessary to be developed to address these challenges[32]. Recently, a number of algorithms that associate a specific phenotype to genes have started to emerge, namely, PHIVE, PhenIX, hiPHIVE, ENDEAVOUR, Phenolyzer, Ingenuity Variant Analysis (Ingenuity) and phenomizer. However, these tools focus on gene association and ranking based on protein-protein interaction networking, cross-species phenotype comparison and HPO terms, and not a comprehensive set of phenotype resources such as the inclusion of the Gene testing Registry (GTR) database and in-house gene-phenotype manual curation, and a few use variant ranking without variant classification. In addition, a validation of these tools has not been performed with clinical samples for use in CLIA or CAP-accredited laboratories.
In this article, we present a clinical exome analysis pipeline, Cincinnati Clinical Exome Pipeline Analysis Suite (CCEPAS), that utilizes a four-level framework that applies a comprehensive in-house phenotype-genotype association tool, Pheno2Gene, in conjunction with a unique gene and variant weighing, filtering and ranking algorithm, VarEval, into one analysis procedure that rapidly places the most likely causative gene variant in the top 20 (trio cases) and top 50 (singleton cases). We validated the performance of Pheno2Gene alone by examining 10 well-known genetic syndromes and compared it to gene lists generated by Phenomizer and Ingenuity, two commonly phenotyping tools. Moreover, we validated Pheno2Gene along with VarEval by analyzing 100 clinical exome cases to identify causal mutations of Mendelian disorders.
Methods
Clinical samples
One hundred pediatric patients referred for exome sequencing have had the analysis and results disclosure completed. The patients in this cohort had diverse clinical features. Before referral, all patients had undergone extensive diagnostic evaluations that did not lead to a unifying diagnosis. Consent for clinical WES and the internal review board (IRB) approval was obtained at Cincinnati Children's Hospital Medical Center (CCHMC) for this study.
WES and Sanger confirmation
WES and analysis protocols were developed and validated by the CCHMC molecular genetics laboratory of the Division of Human Genetics as previously described[33].
Data analysis and variant prioritization
General pipeline description
To aid in the clinical interpretation of variants, data were analyzed and annotated by the clinical analysis pipeline named CCEPAS (Cincinnati Clinical Exome Pipeline Analysis Suite). The pipeline is based on four principles: (1) phenotype-genotype correlations, (2) genetic inheritance models and disease segregation, (3) gene/variant functional effects and (4) database knowledge-based evidence [Figure 1]. Briefly, CEPPAS began with the output data from the Illumina HiSeq 2500 that were converted from bcl files to FastQ files using CASAVA (V1.8) and mapped to the reference human genome (hg19) with the BWA (V0.5.9). Variant calls were obtained using GATK (V7.7.4) and annotated with Alamut HT (V1.1.8).
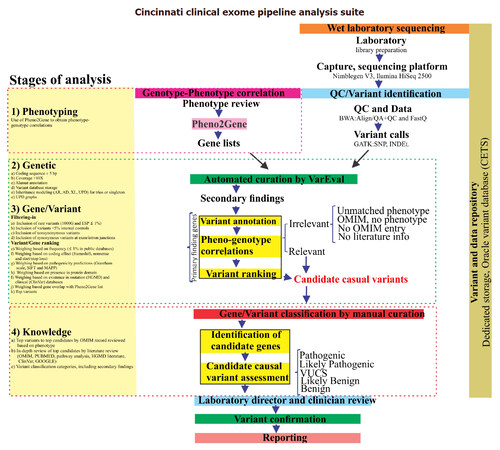
Figure 1. Schematic representation of the Cincinnati Clinical Exome Pipeline Analysis Suite (CCEPAS). The analysis consisted of four stages, namely, phenotyping, genetic, gene/variant (filtering-in and ranking) and knowledge. At the phenotyping stage, cases were reviewed and Pheno2gene was utilized to obtain a gene list based clinical feature keywords. VarEval, an algorithm based on weighing, filtering and scoring, performed the genetic and gene/variants stages. The knowledge based analysis was a manual curation of genes that confirmed the phenotype-genotype correlations and assessment of the pathogenicity of variants, after which variants were classified into five categories. Then, the variants were examined by molecular geneticist and clinician, variants were sent for Sanger confirmation and a report was drafted
Phenotyping stage
Pheno2Gene, an in-house developed tool, was utilized to obtain phenotype-genotype correlations by permitting phenotype keywords to be entered, dynamically searching and displaying results from databases that match those keywords [Figure 2]. Users entered phenotype keywords and once a phenotype or disorder was selected the tool allowed for the gene list to be downloaded as a text file. This text file was for gene and variant prioritization using the variant evaluator (VarEval) algorithm. Pheno2Gene utilized HPO, OMIM, GTR, ORPHANET and in-house manual curations as the main sources of information. In this way the phenotypes were merged with their synonymous equivalents from data sources. A second web-based system was built to allow users to add manual curations in the form of new gene to phenotype associations that were found in the primary literature and not in other databases.
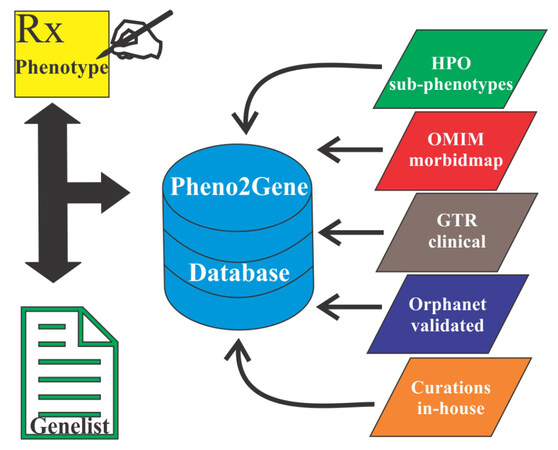
Figure 2. Diagram depicting the resources that Pheno2Gene, a gene list generated based on clinical feature utilized OMIM, HPO and others. OMIM: Online Mendelian Inheritance in Man; HPO: Human Phenotype Ontology; GTR: Gene testing Registry
Genetic stage
At this stage, analysis was restricted to coding sequences ± 5 bp of intron/exon boundaries. In addition, inheritance modeling (AD, AR, XL, UPD for trios, but not for singleton cases) of the variants was performed by VarEval. These models served as guides for the potential inheritance of discovered variants.
Gene/variant stage
At the variant stage, VarEval filtered-in variants on the basis of low frequency found in public databases (dbSNP and ESP database frequencies ≤ 1% or absent) and internal normal control database (frequency ≤ 5%) as well as variant type (inclusion of nonsynonymous and synonymous at exon junctions). VarEval weighed and ranked variants based on low frequency (≤ 1% in public databases: dbSNP, ESP, 1000 genomes and ExAC databases), coding effect (frameshift, nonsense and start/stop loss), pathogenicity predictions (Grantham scale, SIFT and MAPP), presence in protein domain, existence in mutation (HGMD “DM” and “DM?”) and clinical (ClinVar “pathogenic”) variant databases. In general, the algorithm used can be described in general terms as follows[34]:

where si is the “combined score” of variant i, wj is the weight given to prediction algorithm j, and xj is the score of the prediction algorithm j for variant i. Similarly, this equation was applied to the gene weights.
At the gene stage, weight was applied to genes identified by Pheno2Gene, categorizing them into phenotype overlapping and non-OMIM genes. The top variants were examined to ensure that all criteria were met.
Knowledge stage
The top variants became the top candidates for which an OMIM record review was completed to assess the strength of the genotype-phenotype correlation. In the next step, variants that made it through were assessed in-depth by pathway analysis, HGMD, ClinVar, PUBMED and GOOGLE searches. Variants were classified according to the American College of Medical genetics (ACMG) guidelines into five categories; pathogenic, likely pathogenic, variant of unknown clinical significance (VUCS), likely benign or benign. Secondary findings were reported only if they met the criteria of being likely pathogenic or pathogenic variants and the proband/families opted to receive the secondary findings. At the final stage, clinical exome sequencing data interpretation was performed by a team represented by molecular and clinical geneticists, pediatric subspecialists and genetic counselors.
Results
Cohort description
One hundred pediatric patients referred for exome sequencing were analyzed using the Cincinnati Clinical Exome Pipeline Analysis Suite (CCEPAS; Figure 1). The patients in this cohort had diverse array of clinical features including immunodeficiency, neurological disorders and multiple congenital anomalies. There were 32 positive cases, including 9 singletons and 23 trios, from a total of 100 consecutive cases.
Quality metrics
The quality control/quality assurance parameters were measured. The QC/QA acceptable average coverage was > 100× and the percent coverage was > 95% at 10×. The mean average coverage for the 100 case cohort was 114.60×. In addition, the mean percent coverage at 10× and 20× was 97.01% and 95.37%, respectively.
CCEPAS
Phenotyping stage
Variants were analyzed and interpreted by CCEPAS using a weighing and ranking system based on phenotype-genotype correlations, genetic principles, gene/variant deleteriousness and database knowledge-based evidence [Figure 1]. Pheno2Gene was based on HPO, OMIM, GTR, ORPHANET and in-house manual curations, as the sources of information phenotype-genotype correlations [Figure 2]. Users entered phenotype keywords and once a phenotype or disorder was selected the tool allowed for the gene list to be downloaded as a text file. This text file was used for gene prioritization by VarEval.
Before implementation, a Pheno2Gene validation was performed: the accuracy, specificity and sensitivity of 10 known disorders, namely, Fanconi anemia, CHARGE syndrome, Sotos syndrome, Smith-Lemli-Opitz syndrome, Wilson disease, medium-chain acyl-CoA dehydrogenase deficiency, Joubert syndrome, Osteogenesis imperfecta, Marfan syndrome and Rett syndrome. To test Pheno2Gene, ten representative genetic syndromes with diverse clinical features and disorder prevalence with well-defined causative genes were selected to see whether the correct gene lists were provided. Specifically, the disorders were binned into 3 categories: rare (< 1/50,000), fairly common (1/20,000-1/50,000) and common (> 1/20,000) [Figure 3]. In addition, the features of the selected syndrome and included hematological (1 syndrome), connective tissue/skeletal (2 syndromes), neurological (2 syndromes), multiple congenital defects (2 syndromes) and metabolic clinical features (2 syndromes). For each syndrome (phenotype-genotype correlation), we compared the Pheno2Gene gene list output to other popular phenotype-genotype correlational software options, namely, Phenomizer and Ingenuity (Qiagen). The Pheno2Gene accuracy was similar to that of Phenomizer and Ingenuity software [Figure 3]. However, the sensitivity of Pheno2Gene was significantly higher than Phenomizer, but the same as Ingenuity. Notably, Pheno2Gene outperformed Phenomizer and Ingenuity on specificity.
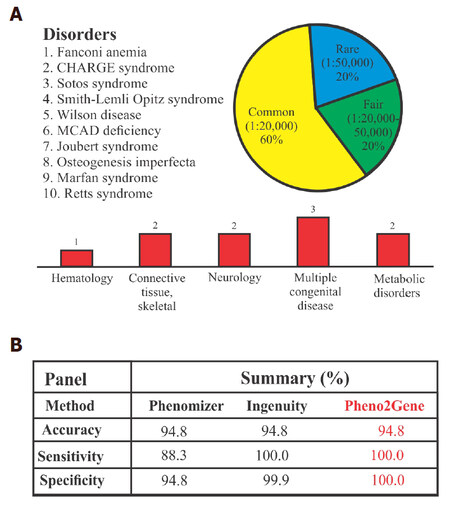
Figure 3. Pheno2Gene validation summary. (A) The validation consisted of using 10 well known syndromes, that are rare to ultra rare with a variety of clinical features; (B) the validation parameters demonstrated that Pheno2Gene is as accurate as Phenomizer and Ingenuity, but it is more sensitive and specific. MCAD: medium-chain acyl-CoA dehydrogenase
Genetic stage and variant stage filtering
At this genetic stage, VarEval filtered-in variants in coding sequences ± 5 bp of intron/exon boundaries (exome region of interest) that were greater than 10X coverage, and fitted variants into inheritance models. VarEval then filtered-in non-synonymous and filtered out variants in pseudogenes, non-HGMD at MAF > 1% ESP and HGMD at MAF > 5%. In addition to filtering, VarEval weighed genes, based on the match to phenotype keywords and variant pathogenicity parameters: ≤ 1% in public databases, namely, dbSNP, ESP, 1000 genomes and ExAC databases, coding effect (frameshift, nonsense and missense), pathogenicity predictions (Grantham scale, SIFT and MAPP), presence in protein domain, existence in mutation (HGMD “DM” and “DM?”) and clinical (ClinVar “pathogenic”) variant databases. For example, a mutation in PAX1 was found rapidly in a clinical case by applying the VarEval algorithm in combination with the utilization of the Pheno2Gene tool [Figure 4A]. Specifically, prior to VarEval there were 153,376 variants, however, the variant number rapidly dropped to 1027 after performing VarEval filtering and to the top variant by weighing and ranking. This example demonstrated the utility of VarEval and Pheno2Gene to rapidly prioritize potential candidate gene variants. Generally, on average prior to VarEval clinical exome cases had approximately 150,000 variants and 500 variants post-VarEval filtering [Figure 4B and C].
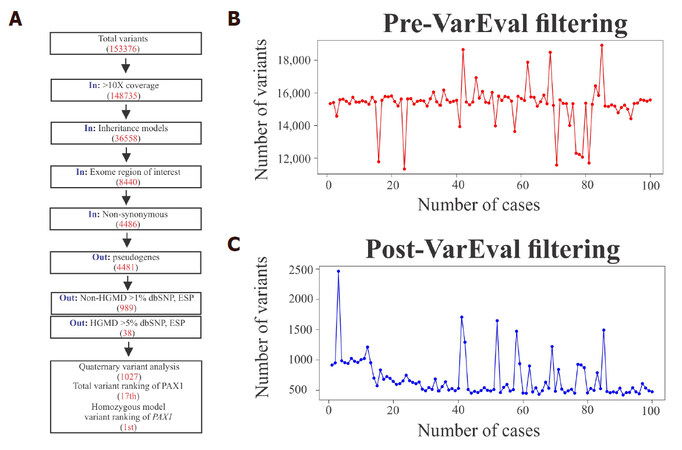
Figure 4. A description of the function of VarEval, an algorithm based on weighing, filtering and ranking genes and variants. (A) A case example of VarEval decreasing the number of variants by filtering (150,000 to 1027 variants) and ranking steps (the 17th position to the 1st position in the homozygous model); (B) prior to filtering, in general, cases had 150,000 variants and (C) this went down to about 500 after VarEval filtering was applied
In addition to filtering, VarEval weighed genes based upon their overlap with gene lists produced by Pheno2Gene, that represented the clinical features of the clinical case. VarEval also weighed variants based on population frequency, computed pathogenicity characteristics, and presence in mutation databases such as ClinVar and HGMD. To demonstrate the effect of filtering and weighing, we ranked the causative variants of 100 clinical exome cases and divided them by inheritance mode. In autosomal dominant cases, the causative variant was found in the top 1, top 10, top 20 and top 50 for 70%, 90%, 100% and 100% of the cases, respectively. Similarly, for autosomal recessive cases, the two causative variants were found in the top 1 and top 20 for 50% and 100% of the cases. Compared to this ranking, X-linked cases were always found to have the causative variants as the top hit. In contrast to trio exome cases, singleton (proband only) cases had a slight reduction of variants in the top 1 (50%), top 10 (70%) and top 20 (70%). For case 7 as an example, the filtering process narrowed down the variants to 1027 and when the gene and variant weights were accounted for, the causative PAX1 variant moved to the 17th position [Figure 4A]. However, it occupied the 1st position of the homozygous inheritance model. Generally, the causative variants were found in the top 50 list for all cases. This example demonstrates the utility of VarEval and Pheno2Gene to rapidly prioritize potential candidate gene variants from thousands of variants to the causative one(s).
Knowledge stage
The filtered variants became top candidates following an OMIM record review based on phenotype. The variants that made it through were assessed in-depth by pathway analysis, HGMD, ClinVar, PUBMED and GOOGLE searches and were classified into five categories: pathogenic, likely pathogenic, VUCS, likely benign or benign. In line with our previous publication, approximately 50% of the likely pathogenic or pathogenic variants have not been previously reported[33]. In contrast, a significant number of reported variants in our exome cases were only recently known by disease-gene discoveries.
Discussion
In the present study, we report an exome analysis pipeline (Cincinnati Children’s Exome Pipeline Suite; CCEPAS) that applied four principles, namely: (1) phenotyping, (2) genetic, (3) gene/variant effects and (4) knowledge-based support, to identify the causative gene variants in 100 clinical cases with diverse phenotypic features [Figure 1]. This pipeline was validated for clinical use and demonstrated to solve more than 30% of cases that were referred for clinical exome testing, mainly trios, which is consistent with other clinical trio-based exome reports[28,29,31,33]. However, this diagnostic yield was closer to 25% when only probands were analyzed[29,30,31,35]. Phenotyping is an important aspect of the any exome pipeline because it links key phenotypic features with corresponding genes. At the initial steps of development, we utilized Phenomizer and Ingenuity for the phenotype to gene correspondence. However, several limitations were observed such as the large number of genes given as an output by Phenomizer per keyword. It was difficult to decipher what the gene cutoff of clinical relevance was for each keyword. Similarly, Ingenuity being a closed source commercial software did not allow us to understand how the phenotype to gene relationships were being made for the clinical validation. These unknowns may be fine for research purposes, but less so for a clinical laboratory service. Thus, we decided to develop a phenotype tool with known information resources (HPO, OMIM, GTR, Orphanet and in-house curations), Pheno2Gene [Figure 2]. To assess the performance of Pheno2Gene, we performed a validation comparison between Pheno2Gene, Ingenuity and Phenomizer utilizing keywords and genes from 10 genetic, rare to ultrarare, disorders with a wide range of clinical features [Figure 3A]. Pheno2Gene’s accuracy, 94.8%, was identical to Phenomizer and Ingenuity [Figure 3A]. However, Pheno2Gene outperformed Phenomizer and Ingenuity in terms of specificity and only Phenomizer in terms of sensitivity. Other reports on clinical exome analysis took into account phenotype-based analysis, however, they only utilized OMIM and HGMD[28,31]. OMIM clinical feature searches can be non-specific with a large number of pages as an output for each keyword, while HGMD phenotype searches miss a number of known and recent phenotype-gene associations. Another group reported using the human phenotype ontology (HPO) and OMIM to make the phenotype to gene associations[29]. Pheno2Gene is a comprehensive tool that has 5 resources (HPO, OMIM, Orphanet, in-house curations and GTR) for obtaining gene lists from clinical features that are frequently updated from resource databases, thus, providing the latest phenotype to gene relationships.
The gene/variant weighing, filtering and ranking stages of the analysis process have been consolidated by one algorithm, named VarEval [Figures 1, 4 and 5]. VarEval used three strategies, namely, weighing (genes and variants), filtering (variants), and ranking (genes and variants), to identify causative gene variants, whereby weighing and ranking are powerful features of VarEval. VarEval weighed variants by the pathogenicity assessment and genes by their association to phenotype. In addition, VarEval filtering along with the aforementioned features rapidly decreased the number of variants from ~150,000 to roughly ~500 [Figure 4]. The third component utilized a ranking approach, whereby, the gene ranking was performed first, most phenotypes matching to the top, and within the gene, variants were sorted by decreasing order of pathogenicity. Thus, the outcome of this ranking approach permitted the phenotypically matching genes with deleterious variants to be, in general, within the top 50 variants for both trio and singleton cases [Figures 4A and 5]. In fact, for autosomal dominant cases, 70% of gene variants that explained the phenotype of case were, indeed, the top 1 variant, and 90% of cases had the causative gene variants in the top 10 variants. This approach, of utilizing Pheno2Gene and VarEval, was validated with 100 clinical exome cases [Figure 5, Supplemental Table 1]. Due to the nature of the weighing, filtering and ranking, CCEPAS also has been used in STAT exome cases. In the future, CCEPAS may be applied to whole genome sequencing analysis, where the gene and variant weighing, filtering and ranking will guide the analysis towards the most important variants to review from millions of variants.
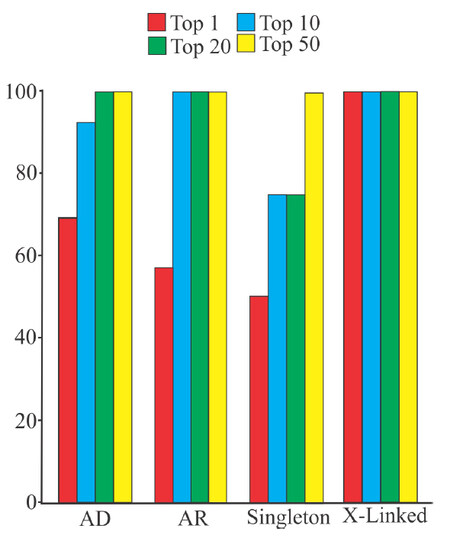
Figure 5. Identification of causative gene variants by Pheno2Gene in conjunction with VarEval in100 clinical exome cases. Importantly, the causative variants were found in the top 20 for autosomal dominant, autosomal recessive and X-linked disorders for 100% of the cases. Moreover, for singleton cases all causative variants were in the top 50 variants for 100% of cases
Supplemental Table 1
| Family ID | Clinically Reported likely pathogenic/pathogenic Variants | Inheritance Model | Model Ranking | VarEval 2.0 Output | ||||||
|---|---|---|---|---|---|---|---|---|---|---|
| Gene | Base Change | Zygosity | Inheritance | Top 50 | Top 20 | Top 10 | Top 1 | |||
| 4 | NFKB2 | c.2598_2599insT | Het | AD | De novo | 1 | Y | Y | Y | Y |
| TNFRSF13B | c.706G>T | Het | AD | AD | 1 | Y | Y | Y | Y | |
| 7 | COL5A1 | c.1588G>A | Het | AD | AD | 4 | Y | Y | Y | N |
| 11 | DYRK1A | c.691C>T | Het | AD | De novo | 1 | Y | Y | Y | Y |
| STXBP1 | c.1217G>A | Het | AD | De novo | 1 | Y | Y | Y | Y | |
| 16 | GJB2 | c.416G>A | Het | AR | Unknown | 5 | Y | Y | Y | N |
| 19 | ASXL3 | c.1383_1386dupTATC | Het | AD | De novo | 4 | Y | Y | Y | N |
| 20 | INS | c.94G>A | Het | AD | De novo | 1 | Y | Y | Y | Y |
| 22 | DCTN1 | c.3146G>A | Het | AD | Dom | 11 | Y | Y | N | N |
| 25 | CPA6 | c.799G>A | Het | AD | Dom | 7 | Y | Y | Y | N |
| 26 | GABRB3 | c.905A>C | Het | AD | De novo | 1 | Y | Y | Y | Y |
| 29 | PIK3CD | c.1002C>G | Het | AD | De novo | 1 | Y | Y | Y | Y |
| 38 | TUBB4A | c.1172G>A | Het | AD | De novo | 1 | Y | Y | Y | Y |
| 41 | SYNE1 | c.6929A>T | Het | AD | Unknown | 25 | Y | N | N | N |
| SYNE1 | c.6955G>A | Het | AD | Unknown | 26 | Y | N | N | N | |
| PYR1 | c.3389G>A | Het | AD | Unknown | 1 | Y | Y | Y | Y | |
| 47 | DYNC1H1 | c.1013A>T | Het | AD | De novo | 1 | Y | Y | Y | Y |
| 48 | PAX1 | c.463_465del | Homo | AR | Hom | 1 | Y | Y | Y | Y |
| 50 | NPC1 | c.3019C>G | Het | AR | CoH | 1 | Y | Y | Y | Y |
| 60 | CACNA1C | c.3577G>T | Het | AD | Unknown | 46 | Y | N | N | N |
| 65 | NPC1 | c.3450C>A | Het | AR | CoH | 2 | Y | Y | Y | N |
| CTPS1 | c.1692-1G>C | Homo | AR | Hom | 1 | Y | Y | Y | Y | |
| 66 | NPR2 | c.263A>C | Homo | AR | UPD | 1 | Y | Y | Y | Y |
| 68 | C2CD3 | c.1736T>G | Het | AR | CoH | 7 | Y | Y | Y | N |
| C2CD3 | c.593_4596delAA | Het | AR | CoH | 6 | Y | Y | Y | N | |
| 70 | TTC7A | c.211G>A | Het | AR | CoH | 1 | Y | Y | Y | Y |
| TTC7A | c.1013_1014delC | Het | AR | CoH | 2 | Y | Y | Y | N | |
| 71 | PLA2G6 | c.278C>A | Het | AR | CoH | 1 | Y | Y | Y | Y |
| 74 | VHL | c.340+5G>C | Het | AD | Unknown | 1 | Y | Y | Y | Y |
| HBB | c.242C>G | Het | AD | Unknown | 2 | Y | Y | Y | N | |
| 78 | CTLA4 | c.90_104del15 | Het | AD | Unknown | 1 | Y | Y | Y | Y |
| 80 | CTLA4 | c.151C>T | Het | AD | Unknown | 1 | Y | Y | Y | Y |
| 81 | CTLA4 | c.151C>T | Het | AD | Unknown | 1 | Y | Y | Y | Y |
| 82 | CTLA4 | c.151C>T | Het | AD | Unknown | 1 | Y | Y | Y | Y |
| 84 | STAT1 | c.1154C>T | Het | AD | Unknown | 3 | Y | Y | Y | N |
| 86 | PLA2G6 | c.2070_2072del | Het | AR | CoH | 2 | Y | Y | Y | N |
| 93 | ECHS1 | c.266G>T | Het | AR | CoH | 1 | Y | Y | Y | Y |
| ECHS1 | c.518C>T | Het | AR | CoH | 2 | Y | Y | Y | N | |
| 95 | MEFV | c.586G>T | Homo | AR | Hom | 1 | Y | Y | Y | Y |
| 100 | PCDH19 | c.3355G>A | Het | XL | XLD | 1 | Y | Y | Y | Y |
| 105 | XIAP | c.664C>T | Het | XL-R | DeN | 1 | Y | Y | Y | Y |
Compared to CCEPAS, previous clinical exome analysis pipelines have demonstrated similarities and differences. Farwell et al.[28] described filtering by MAF < 1% (ESP and 1000G), nonsynonymous changes, splicing site alterations, inheritance modeling in a trio setting and included genes in HGMD and OMIM with phenotypic overlap similar to CCEPAS [Figure 1]. Similarly, Retterer et al.[29] reported filtering by < 1%, but only from 1000 Genomes project unlike CCEPAS which includes ESP. In addition, Retterer et al.[29] reported doing inheritance modeling, examined genes that overlapped with the primary phenotype as well as variants listed in HGMD, examined mutation categories, and classified variants into 4 categories (category 1: positive case, mutations or variant likely mutations in disease genes associated with the reported phenotype; category 2: VUS case, variants in genes possibly associated with the reported phenotype or variants of unknown significance in disease genes associated with the phenotype; category 3: candidate gene case, candidate genes with a potential relationship to a disease phenotype; category 4: negative case, no variants in genes associated with the reported phenotype were found). In contrast to Retterer’s category approach, CCEPAS analysts examined all variants produced by the algorithm and variant classification was performed on a per variant basis due to the subjective nature of phenotype-genotype and variant pathogenicity correlations. Yang et al.[30] devised a different approach than CCEPAS and used 1000G and ESP inclusion frequency of < 1%, but also examine HGMD and non-HGMD variants (i.e., affecting protein coding or RNA splicing) with inclusion ESP frequency inclusion of < 5% for HGMD and < 1% for non-HGMD.
In summary, we demonstrated the development, validation and implementation of CCEPAS, an exome analysis pipeline that utilized Pheno2Gene in conjunction with VarEval. Its unique Pheno2Gene tool utilized an extensive list of resources, provided an accurate, sensitive and specific way to obtain gene lists from clinical features. Also, the combination of weighing, filtering and ranking by VarEval reduced the list of variants to be analyzed from ~150,000 down to the top 20 (trios) and top 50 (singleton) a relatively easy and speedy process for finding the genetic cause that has eluded patients for years, thus, ending the diagnostic odyssey.
Declarations
Authors’ contributionsConceptualized and initiated the study, collected, analyzed, and interpreted the data, wrote and reviewed the manuscript: Valencia CA, Zhang K
Developed the bioinformatics analysis pipeline through the VarEval algorithm and reviewed the manuscript: Mathur A
Developed the phenotyping tool Pheno2Genet and reviewed the manuscript: Denton J
Performed the data analyses and reviewed the manuscript: Wei C, Wang X, Husami A
Developed the hardware infrastructure and storage of the high performance computer (HPC): Velayutham P, Ryumae M
Approved the final manuscript as submitted and agree to be accountable for all aspects of the work: all authors
Data source and availabilityIRB approval was obtained at CCHMC for this study; however, authorization for public sharing of this clinical data was not granted.
Financial support and sponsorshipThis work was supported by the operating funds from the Molecular Laboratory at CCHMC. A patent application (62/608,137 filed on 12/20/17) has been submitted by the CCHMC Center for Technology Commercialization based on these results.
Conflicts of interestThe authors declare that the research was conducted in the absence of any commercial or financial relationships that could be construed as a potential conflict of interest.
Patient consentConsent was obtained.
Ethics approvalThe internal review board approval was obtained at Cincinnati Children’s Hospital Medical Center for this study.
Copyright© The Author(s) 2018.
REFERENCES
1. Antonarakis SE, Beckmann JS. Mendelian disorders deserve more attention. Nat Rev Genet 2006;7:277-82.
2. Ng SB, Buckingham KJ, Lee C, Bigham AW, Tabor HK, Dent KM, Huff CD, Shannon PT, Jabs EW, Nickerson DA, Shendure J, Bamshad MJ. Exome sequencing identifies the cause of a mendelian disorder. Nat Genet 2010;42:30-5.
4. McCarthy MI, Hattersley AT. Learning from molecular genetics: novel insights arising from the definition of genes for monogenic and type 2 diabetes. Diabetes 2008;57:2889-98.
5. McCarthy MI. Exploring the unknown: assumptions about allelic architecture and strategies for susceptibility variant discovery. Genome Med 2009;1:66.
6. Choi M, Scholl UI, Ji W, Liu T, Tikhonova IR, Zumbo P, Nayir A, Bakkaloğlu A, Ozen S, Sanjad S, Nelson-Williams C, Farhi A, Mane S, Lifton RP. Genetic diagnosis by whole exome capture and massively parallel DNA sequencing. Proc Natl Acad Sci U S A 2009;106:19096-101.
7. Boehnke M. Limits of resolution of genetic linkage studies: implications for the positional cloning of human disease genes. Am J Hum Genet 1994;55:379-90.
8. Hoischen A, van Bon BWM, Gilissen C, Arts P, van Lier B, Steehouwer M, de Vries P, de Reuver R, Wieskamp N, Mortier G, Devriendt K, Amorim MZ, Revencu N, Kidd A, Barbosa M, Turner A, Smith J, Oley C, Henderson A, Hayes IM, Thompson EM, Brunner HG, de Vries BB, Veltman JA. De novo mutations of SETBP1 cause Schinzel-Giedion syndrome. Nat Genet 2010;42:483-5.
9. Johnson JO, Mandrioli J, Benatar M, Abramzon Y, Van Deerlin VM, Trojanowski JQ, Gibbs JR, Brunetti M, Gronka S, Wuu J, Ding J, McCluskey L, Martinez-Lage M, Falcone D, Hernandez DG, Arepalli S, Chong S, Schymick JC, Rothstein J, Landi F, Wang YD, Calvo A, Mora G, Sabatelli M, Monsurrò MR, Battistini S, Salvi F, Spataro R, Sola P, Borghero G; ITALSGEN Consortium, Galassi G, Scholz SW, Taylor JP, Restagno G, Chiò A, Traynor BJ. Exome sequencing reveals VCP mutations as a cause of familial ALS. Neuron 2010;68:857-64.
10. Krawitz PM, Schweiger MR, Rödelsperger C, Marcelis C, Kölsch U, Meisel C, Stephani F, Kinoshita T, Murakami Y, Bauer S, Isau M, Fischer A, Dahl A, Kerick M, Hecht J, Köhler S, Jäger M, Grünhagen J, de Condor BJ, Doelken S, Brunner HG, Meinecke P, Passarge E, Thompson MD, Cole DE, Horn D, Roscioli T, Mundlos S, Robinson PN. Identity-by-descent filtering of exome sequence data identifies PIGV mutations in hyperphosphatasia mental retardation syndrome. Nat Genet 2010;42:827-9.
11. Lalonde E, Albrecht S, Ha KCH, Jacob K, Bolduc N, Polychronakos C, Dechelotte P, Majewski J, Jabado N. Unexpected allelic heterogeneity and spectrum of mutations in Fowler syndrome revealed by next-generation exome sequencing. Hum Mutat 2010;31:918-23.
12. Musunuru K, Pirruccello JP, Do R, Peloso GM, Guiducci C, Sougnez C, Garimella KV, Fisher S, Abreu J, Barry AJ, Fennell T, Banks E, Ambrogio L, Cibulskis K, Kernytsky A, Gonzalez E, Rudzicz N, Engert JC, DePristo MA, Daly MJ, Cohen JC, Hobbs HH, Altshuler D, Schonfeld G, Gabriel SB, Yue P, Kathiresan S. Exome sequencing, ANGPTL3 mutations, and familial combined hypolipidemia. N Engl J Med 2010;363:2220-7.
13. Ng SB, Bigham AW, Buckingham KJ, Hannibal MC, McMillin MJ, Gildersleeve HI, Beck AE, Tabor HK, Cooper GM, Mefford HC, Lee C, Turner EH, Smith JD, Rieder MJ, Yoshiura K, Matsumoto N, Ohta T, Niikawa N, Nickerson DA, Bamshad MJ, Shendure J. Exome sequencing identifies MLL2 mutations as a cause of Kabuki syndrome. Nat Genet 2010;42:790-3.
14. Pierce SB, Walsh T, Chisholm KM, Lee MK, Thornton AM, Fiumara A, Opitz JM, Levy-Lahad E, Klevit RE, King MC. Mutations in the DBP-deficiency protein HSD17B4 cause ovarian dysgenesis, hearing loss, and ataxia of Perrault Syndrome. Am J Hum Genet 2010;87:282-8.
15. Majewski J, Schwartzentruber J, Lalonde E, Montpetit A, Jabado N. What can exome sequencing do for you? J Med Genet 2011;48:580-9.
17. Browning BL, Browning SR. A fast, powerful method for detecting identity by descent. Am J Hum Genet 2011;88:173-82.
18. Rödelsperger C, Krawitz P, Bauer S, Hecht J, Bigham AW, Bamshad M, de Condor BJ, Schweiger MR, Robinson PN. Identity-by-descent filtering of exome sequence data for disease-gene identification in autosomal recessive disorders. Bioinforma Oxf Engl 2011;27:829-36.
19. Abecasis GR, Cherny SS, Cookson WO, Cardon LR. Merlin--rapid analysis of dense genetic maps using sparse gene flow trees. Nat Genet 2002;30:97-101.
20. Ng PC, Henikoff S. Predicting the effects of amino acid substitutions on protein function. Ann Rev Genomics Hum Genet 2006;7:61-80.
21. Teng S, Michonova-Alexova E, Alexov E. Approaches and resources for prediction of the effects of non-synonymous single nucleotide polymorphism on protein function and interactions. Curr Pharm Biotechnol 2008;9:123-33.
22. Kumar P, Henikoff S, Ng PC. Predicting the effects of coding non-synonymous variants on protein function using the SIFT algorithm. Nat Protoc 2009;4:1073-81.
23. Adzhubei IA, Schmidt S, Peshkin L, Ramensky VE, Gerasimova A, Bork P, Kondrashov AS, Sunyaev SR. A method and server for predicting damaging missense mutations. Nat Meth 2010;7:248-9.
24. Chun S, Fay JC. Identification of deleterious mutations within three human genomes. Genome Res 2009;19:1553-61.
25. Schwarz JM, Rödelsperger C, Schuelke M, Seelow D. Mutation taster evaluates disease-causing potential of sequence alterations. Nat Meth 2010;7:575-6.
26. Liu X, Jian X, Boerwinkle E. dbNSFP: a lightweight database of human nonsynonymous SNPs and their functional predictions. Hum Mutat 2011;32:894-9.
27. Wang K, Li M, Hakonarson H. ANNOVAR: functional annotation of genetic variants from high-throughput sequencing data. Nucleic Acids Res 2010;38:e164.
28. Farwell KD, Shahmirzadi L, El-Khechen D, Powis Z, Chao EC, Tippin Davis B, Baxter RM, Zeng W, Mroske C, Parra MC, Gandomi SK, Lu I, Li X, Lu H, Lu HM, Salvador D, Ruble D, Lao M, Fischbach S, Wen J, Lee S, Elliott A, Dunlop CL, Tang S. Enhanced utility of family-centered diagnostic exome sequencing with inheritance model-based analysis: results from 500 unselected families with undiagnosed genetic conditions. Genet Med 2015;17:578-86.
29. Retterer K, Juusola J, Cho MT, Vitazka P, Millan F, Gibellini F, Vertino-Bell A, Smaoui N, Neidich J, Monaghan KG, Bai R, Suchy S, Friedman B, Tahiliani J, Pineda-Alvarez D, Richard G, Brandt T, Haverfield E, Chung WK, Bale S. Clinical application of whole-exome sequencing across clinical indications. Genet Med 2016;18:696-704.
30. Yang Y, Muzny DM, Reid JG, Bainbridge MN, Willis A, Ward PA, Braxton A, Beuten J, Xia F, Niu Z, Hardison M, Person R, Bekheirnia MR, Leduc MS, Kirby A, Pham P, Scull J, Wang M, Ding Y, Plon SE, Lupski JR, Beaudet AL, Gibbs RA, Eng CM. Clinical whole-exome sequencing for the diagnosis of mendelian disorders. N Engl J Med 2013;369:1502-11.
31. Lee H, Deignan JL, Dorrani N, Strom SP, Kantarci S, Quintero-Rivera F, Das K, Toy T, Harry B, Yourshaw M, Fox M, Fogel BL, Martinez-Agosto JA, Wong DA, Chang VY, Shieh PB, Palmer CG, Dipple KM, Grody WW, Vilain E, Nelson SF. Clinical exome sequencing for genetic identification of rare Mendelian disorders. JAMA 2014;312:1880-7.
32. Bone WP, Washington NL, Buske OJ, Adams DR, Davis J, Draper D, Flynn ED, Girdea M, Godfrey R, Golas G, Groden C, Jacobsen J, Köhler S, Lee EM, Links AE, Markello TC, Mungall CJ, Nehrebecky M, Robinson PN, Sincan M, Soldatos AG, Tifft CJ, Toro C, Trang H, Valkanas E, Vasilevsky N, Wahl C, Wolfe LA, Boerkoel CF, Brudno M, Haendel MA, Gahl WA, Smedley D. Computational evaluation of exome sequence data using human and model organism phenotypes improves diagnostic efficiency. Genet Med 2016;18:608-17.
33. Valencia CA, Husami A, Holle J, Johnson JA, Qian Y, Mathur A, Wei C, Indugula SR, Zou F, Meng H, Wang L, Li X, Fisher R, Tan T, Hogart Begtrup A, Collins K, Wusik KA, Neilson D, Burrow T, Schorry E, Hopkin R, Keddache M, Harley JB, Kaufman KM, Zhang K. Clinical impact and cost-effectiveness of whole exome sequencing as a diagnostic tool: a pediatric center's experience. Front Pediatr 2015;3:67.
34. O'Fallon BD, Wooderchak-Donahue W, Bayrak-Toydemir P, Crockett D. VarRanker: rapid prioritization of sequence variations associated with human disease. BMC Bioinformatics 2013;14 Suppl 13:S1.
35. Yang Y, Muzny DM, Xia F, Niu Z, Person R, Ding Y, Ward P, Braxton A, Wang M, Buhay C, Veeraraghavan N, Hawes A, Chiang T, Leduc M, Beuten J, Zhang J, He W, Scull J, Willis A, Landsverk M, Craigen WJ, Bekheirnia MR, Stray-Pedersen A, Liu P, Wen S, Alcaraz W, Cui H, Walkiewicz M, Reid J, Bainbridge M, Patel A, Boerwinkle E, Beaudet AL, Lupski JR, Plon SE, Gibbs RA, Eng CM. Molecular findings among patients referred for clinical whole-exome sequencing. JAMA 2014;312:1870-9.
Cite This Article
Export citation file: BibTeX | RIS
OAE Style
Valencia CA, Mathur A, Denton J, Wei C, Wang X, Husami A, Velayutham P, Ryumae M, Zhang K. CCEPAS: the creation and validation of a fast and sensitive clinical whole exome analysis pipeline based on gene and variant ranking. J Transl Genet Genom 2018;2:1. http://dx.doi.org/10.20517/jtgg.2017.05
AMA Style
Valencia CA, Mathur A, Denton J, Wei C, Wang X, Husami A, Velayutham P, Ryumae M, Zhang K. CCEPAS: the creation and validation of a fast and sensitive clinical whole exome analysis pipeline based on gene and variant ranking. Journal of Translational Genetics and Genomics. 2018; 2: 1. http://dx.doi.org/10.20517/jtgg.2017.05
Chicago/Turabian Style
Valencia, C. Alexander, Abhinav Mathur, James Denton, Chao Wei, Xinjian Wang, Ammar Husami, Prakash Velayutham, Masaru Ryumae, Kejian Zhang. 2018. "CCEPAS: the creation and validation of a fast and sensitive clinical whole exome analysis pipeline based on gene and variant ranking" Journal of Translational Genetics and Genomics. 2: 1. http://dx.doi.org/10.20517/jtgg.2017.05
ACS Style
Valencia, CA.; Mathur A.; Denton J.; Wei C.; Wang X.; Husami A.; Velayutham P.; Ryumae M.; Zhang K. CCEPAS: the creation and validation of a fast and sensitive clinical whole exome analysis pipeline based on gene and variant ranking. J. Transl. Genet. Genom. 2018, 2, 1. http://dx.doi.org/10.20517/jtgg.2017.05
About This Article
Copyright

Data & Comments
Data
0

 Cite This Article 10 clicks

 Like This Article 0
likes
Like This Article 0
likes


Comments
Comments must be written in English. Spam, offensive content, impersonation, and private information will not be permitted. If any comment is reported and identified as inappropriate content by OAE staff, the comment will be removed without notice. If you have any queries or need any help, please contact us at support@oaepublish.com.