
Plasma microRNA profiles identify distinct clinical phenotypes in human asthmatics

Abstract
Aim: Asthma is a chronic inflammatory syndrome that is characterized by heterogeneous disease pathogeneses that produce distinct subtypes. There is a great need to develop biomarkers to distinguish these subtypes and help guide specific therapy and better predict outcomes, particularly in severe asthma where a number of targeted therapeutics are now available. We sought to determine whether expression of asthma-specific microRNAs (miRNAs) could distinguish phenotypic differences in a diverse cohort of asthmatic subjects that spanned a range of disease severity.
Methods: RNA was isolated from peripheral blood from human subjects. Expression of 39 miRNAs was then screened. Sample cycle threshold values were normalized. Normally distributed data were analyzed and hierarchical cluster was performed.
Results: Peripheral blood was obtained from 62 adults. We identified four clusters of asthmatics defined by 5 distinct miRNA expression patterns. Cluster 1 was associated with mild asthma, low inhaled corticosteroid use, and low eosinophil levels. Cluster 3 and 4 consisted primarily of severe asthmatics with poor asthma control, and Cluster 3 was specifically associated with high IgE, high blood eosinophil levels, and racial disparity (higher proportion of Black subjects). Cluster 2 was comprised predominantly of mild-moderate asthmatics that had higher blood eosinophils than Cluster 1.
Conclusion: These results indicate the miRNA expression profiling can be useful to identify distinct asthma phenotypes, and have potential to better understand disease pathogenesis and help guide therapy.
Keywords
Introduction
Asthma affects approximately 300 million people worldwide and is associated with significant morbidity[1]. It is characterized by high burden of healthcare utilizations due to the cost of medications and hospitalizations/clinic visits, and poor quality of life that includes chronic symptoms and frequent days of missed school/work[2,3].
Our understanding of asthma pathogenesis is still incomplete. However, there has been a recent paradigm shift from thinking of asthma as a single disease, to now considering it a syndrome comprised of distinct phenotypes. Several asthma phenotypes have been identified (based on clinical characteristics, biomarkers, and response to treatment), including early onset allergic, late onset eosinophilic, exercise induced, obesity related, and neutrophilic[4]. However, assigning patients to these phenotypes is not always straightforward, and these phenotypes may have overlapping clinical features and disease pathogeneses. As asthma arising from different disease pathogeneses may produce different clinical courses with variable response to specific asthma medications, it is important to develop biomarkers that have the ability to identify these subtypes at the time of asthma diagnosis.
A number of recent studies have identified unique subtypes of asthmatics that were defined based on a cluster analysis of clinical variables[5]. These groups exhibited differences in eosinophil levels, severity, and need for medications to control asthma[5]. In particular, distinguishing between eosinophilic and non-eosinophilic subtypes may be crucial for treatment, as it has been shown that non-eosinophilic asthmatics respond poorly to corticosteroids[6]. However, there may also be sub-phenotypes within a particular group (i.e., subgroups of eosinophilic asthmatics) that are difficult to distinguish with current tools such as blood eosinophil levels, allergen testing, and fractional exhaled nitrous oxide (FeNO). Blood eosinophil levels do not always correlate with tissue eosinophil levels. Similarly, FeNO levels are not an accurate tool to measure airway eosinophilia. Levels can be altered by medications and the presence of allergic rhinitis, and there is an intermediate range of values that is difficult to interpret. Better tools are needed to more accurately identify subgroups of asthmatics and provide more precise information. Ideal biomarkers would better classify subtypes, help guide therapy, predict outcomes, and provide information about what immunological pathways are de-regulated in the specific subtypes.
MicroRNAs (miRNAs) may be an important biomarker to address many of these issues. MiRNAs are short, single stranded, non-coding RNAs that can regulate gene expression by interacting with mRNAs post transcription. MiRNAs are involved in numerous disease processes across many cells and systems. MiRNAs are readily detectable in blood, and expression profiles may be useful noninvasive biomarkers in various diseases, including asthma[7-9]. Our previous work has demonstrated that miRNAs can distinguish asthmatic from non-asthmatics subjects, that specific miRNAs may de-regulated in eosinophilic asthmatics, and that these molecules regulate inflammatory pathways in airway epithelial cells and T-cells[7]. Thus, miRNAs may represent an important bridge between molecular pathways and clinical entities.
Previous research showed that miR-125b, miR-16, miR-299-5p, miR-126, miR-206, and miR-133b levels were predictive of allergic and asthmatic status[7]. These, along with a host of other miRNAs, were found to be differentially expressed amongst healthy, allergic, and asthmatic patients. In this study, we determined whether these previously identified miRNAs could identify subgroups with differing response to treatments and asthma control.
Methods
Study population (sample size, characteristics of population)
This study was approved by Penn State College of Medicine Institutional Review Board. Participants signed informed consent forms. Patients were classified as asthmatics based on history, and forced expiratory volume in 1 s (FEV1) reversible by more than 12% and more than 200 mL after bronchodilator or airway hyper-responsiveness from methacholine challenge producing more than 20% decrease in FEV1 of less than 8 mg/mL. Asthma control was assessed using the asthma control test (ACT)[10]. There are some asthmatics who do not respond to albuterol. We also included patients who had a history and physical exam consistent with asthma (wheezing, shortness of breath with absence of history of chronic obstructive pulmonary disease or other lung disease) in conjunction with reduced FEV1/forced vital capacity (FVC) ratio < 0.7, or demonstrated evidence of airway hyper-reactivity as follows: greater than a 10% increase in FEV1 after maximal anti-inflammatory treatment with 40 mg of prednisone for ≥ 1 week, or more than a 12% variability in FEV1 on serial spirometry obtained at clinic visits over the span of 12 months.
RNA isolation
Venous blood was collected peripherally, then centrifuged at 300 rpm in a clinical centrifuge to isolate plasma. 2 µL of 50 nmol/L synthetic cel-miR-39 was added as a “spike in” normalization to 500 µL of plasma for RNA isolation. Then, 1.5 mL of TRIzol reagent was added and total RNA was extracted according to the manufacturer’s protocol. Finally, RNA concentration was measured based on A260/280 with NanoDrop Lite Spectrophotometer.
cDNA preparation
Expression of 39 miRNAs in plasma was screened with using our previously published protocols[7]. Briefly, up to 500 ng of total RNA was reverse transcribed to cDNA with the qScript miRNA cDNA synthesis kit.
MiRNA expression by qPCR
MiRNA quantification with qPCR was performed on the CFX384 real-time system. cDNA was diluted 1:10. Primers to each miRNA were obtained from integrated DNA technologies. Each sample was run in quadruplet. A 2-step program was used as follows: 40 cycles of 95 ºC for 10 s and 60 ºC for 30 s. Sample cycle threshold (Ct) values were normalized to cel-miR-39 to control for variability.
Statistics
Normally distributed data were analyzed by one-way analysis of variance with Tukey post-test for multiple comparisons or Student’s t-test where appropriate. Fisher’s exact tests were used for categorical binary variables, and Chi-squared test for categorical variables across more than two groups. Hierarchical cluster analysis was performed in Cluster 3.0 using the average-linkage method[11].
Results
Our previous work indicated that plasma miRNAs have the potential to identify asthma phenotypes, and we identified a panel of 39 miRNAs that had potential to serve as non-invasive biomarkers in the blood[7]. In this study, we built on these findings and used qPCR to analyze their expression in n = 62 asthmatics that spanned the range of severity, including difficult to control asthmatic subjects (demographics in Table 1).
Study demographics
| Asthmatic subjects (n = 62) | |
|---|---|
| Age (mean ± SD) | 43.5 ± 14.6 |
| Gender (number) | Female (n = 40), Male (n = 22) |
| Race (W/B/A); Ethnicity (H)1 | n = 47 W, n = 13 B, n = 2 A; n = 3 H |
| BMI (mean ± SD) | 31.5 ± 9.1 |
| Asthma duration (mean ± SD) | 22.3 ± 14.7 |
| Daily ICS dose2 (mean ± SD) | 570.5 ± 466.2 |
| FVC (%, mean ± SD) | 84.4 ± 17.7 |
| FEV1 (%, mean ± SD) | 69.5 ± 21.5 |
| FEV1/FVC ratio (mean ± SD) | 0.66 ± 0.13 |
| FEV1% (mean ± SD) | 69.5 ± 21.5 |
| Blood eosinophil (cells/µL, mean ± SD)3 | 343.5 ± 316.4 |
| Total IgE (kIU/mL, mean ± SD)4 | 522.2 ± 480.3 |
| Number with aeroallergen sensitivity (≥ 1 positive test) | 54 (87%) |
We first asked whether miRNA expression profiles were associated with different clinical features of asthma. A cluster analysis of the miRNA expression data identified four main clusters of subjects, which we labeled Cluster 1-4 [Figure 1, X-axis]. The patterns of miRNA expression that led to definition of these clusters could be generally separated into different 5 groups [Figure 1, Y-axis]. We then analyzed the miRNA patterns in each of the clusters and determined whether they were associated with differences in demographics and clinical features of asthma.
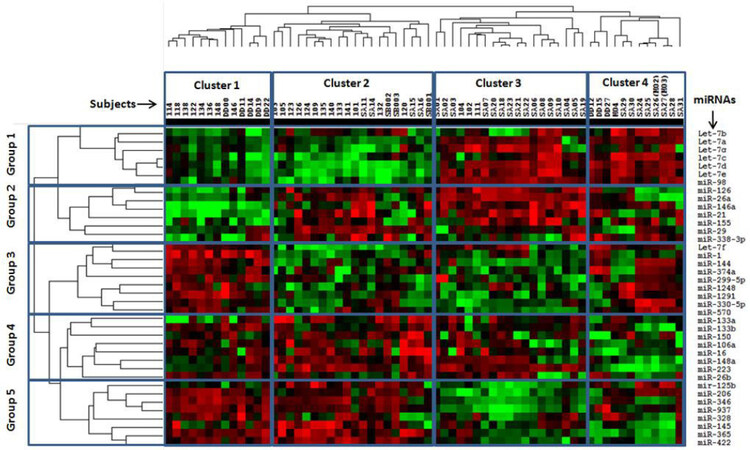
Figure 1. Heat map of miRNA expression profiles. Four clusters of subjects were identified and miRNA expression patterns fit into five main groups
The miRNAs assigned to group 1 (Let7 family and miR-98) showed higher expression in Cluster 3 and 4 relative to Clusters 1 and 2 [Figure 2, Table 2]. However, we also observed differences in miRNA expression between Cluster 1 and 2 as well, with expression generally being lower in the latter [Figure 2A, miR-98 as a representative example].
Grouping of miRNAs from cluster analysis
| Name | Group | P-value | Significant comparisons from Tukey post-hoc tests |
|---|---|---|---|
| Let-7d | 1 | 8.02E-13 | 1-2; 4-1; 3-2; 4-2; 4-3 |
| Let-7e | 1 | 4.78E-12 | 1-2; 4-1; 3-2; 4-2; 4-3 |
| miR-98 | 1 | 1.39E-10 | 1-2; 3-1; 4-1; 3-2; 4-2 |
| let-7c | 1 | 5.84E-08 | 4-1; 3-2; 4-2; 4-3 |
| Let-7b | 1 | 5.7E-06 | 4-1; 4-2; 4-3 |
| Let-7a | 1 | 0.002215 | 4-1; 4-2; 4-3 |
| Let-7g | 1 | 0.02949 | |
| miR-146a | 2 | 8.09E-06 | 2-1; 3-1; 4-1; 3-2 |
| miR-26a | 2 | 2.1E-05 | 3-1; 1-4; 3-2; 2-4; 3-4 |
| miR-126 | 2 | 9.80E-05 | 3-1; 2-4; 3-4 |
| miR-21 | 2 | 5.82E-04 | 2-1; 3-1; 4-1; 3-4 |
| miR-338-3p | 2 | 0.003743 | 4-1; 2-3; 4-3 |
| miR-29 | 2 | 0.010592 | 1-3; 2-3; 2-4 |
| miR-1 | 3 | 8.15E-12 | 1-2; 1-3; 1-4 |
| miR-570 | 3 | 7.84E-11 | 1-2; 1-3; 2-3; 4-2; 4-3 |
| miR-144 | 3 | 2.44E-10 | 1-2; 1-3; 2-3; 4-2; 4-3 |
| miR-1291 | 3 | 1.78E-08 | 1-2; 1-3; 1-4; 2-3; 4-2; 4-3 |
| miR-330-5p | 3 | 3.23E-08 | 1-2; 1-3; 4-2; 4-3 |
| Let-7f | 3 | 1.05E-06 | 1-2; 1-3; 3-2; 4-2; 4-3 |
| miR-374a | 3 | 3.58E-06 | 1-2; 1-3; 4-2; 4-3 |
| miR-299-5p | 3 | 4.69E-05 | 1-2; 1-3; 1-4; 4-3 |
| miR-1248 | 3 | 5.61E-05 | 1-2; 1-3; 4-2; 4-3 |
| miR-223 | 4 | 4.2E-16 | 1-4; 2-4; 3-4 |
| miR-133b | 4 | 9.32E-06 | 1-2; 1-3; 1-4; 2-4; 3-4 |
| miR-148a | 4 | 1E-05 | 1-4; 2-4; 3-4 |
| miR-16 | 4 | 7.24E-04 | 1-3; 1-4; 2-3; 2-4 |
| miR-106a | 4 | 0.002195 | 1-3; 1-4; 2-3; 2-4 |
| miR-26b | 4 | 0.005422 | 1-2; 1-3; 1-4 |
| miR-150 | 4 | 0.008776 | 1-4; 2-3; 2-4 |
| miR-133a | 4 | 0.025097 | 2-1; 2-3; 2-4 |
| miR-937 | 5 | 2.82E-18 | 1-2; 1-3; 1-4; 2-3; 4-3 |
| miR-206 | 5 | 2.47E-15 | 1-2; 1-3; 2-3; 4-3 |
| miR-365 | 5 | 6.49E-14 | 1-2; 1-3; 1-4; 2-3; 2-4; 3-4 |
| miR-346 | 5 | 4.9E-11 | 1-2; 1-3; 1-4; 2-3; 2-4; 4-3 |
| miR-422 | 5 | 7.04E-08 | 1-3; 1-4; 2-3; 2-4 |
| mir-125b | 5 | 1.62E-07 | 1-3; 2-3; 4-3 |
| miR-145 | 5 | 1.24E-05 | 1-3; 1-4; 2-3; 2-4; 3-4 |
| miR-328 | 5 | 0.002629 | 1-2; 1-3; 1-4 |
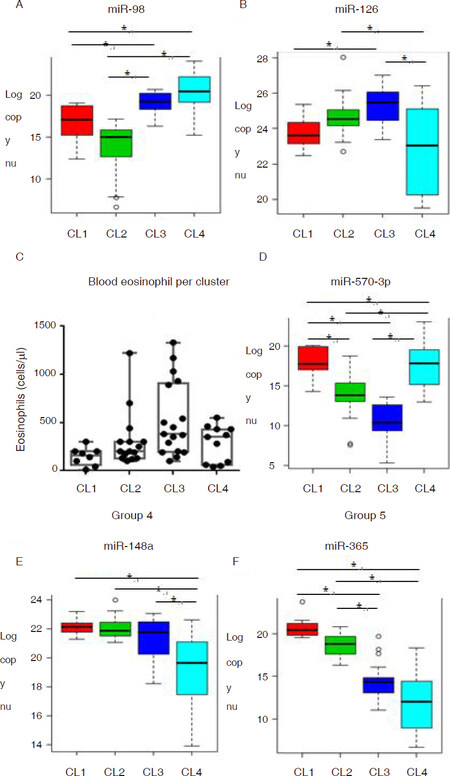
Figure 2. Representative miRNA expression patterns in each group. Box and whisker plots of representative miRNAs in each of the five groups identified (panels A, B, D-F), and blood eosinophil levels (panel C). CL: cluster
For the miRNAs categorized in group 2, expression was lower in Cluster 1 relative to other clusters [Figure 2B] while expression of group 3 miRNAs was higher in Cluster 1 than the other groups [Figure 2C]. Closer inspection of miRNAs in group 2 and group 3 revealed an interesting trend, where expression appeared to track the eosinophilia. In group 2, expression tended to be the highest in Cluster 3, followed by Cluster 2, and then Cluster 1 and 4 [Figure 2B]. Blood eosinophil levels showed a similar trend, with the highest levels in Cluster 3, followed by Cluster 2, then Cluster 1, and Cluster 4 showing a distribution from low to high values [Figure 2C]. For miRNAs in group 3, an opposite pattern was seen - with the lowest expression in Cluster 3, next lowest in Cluster 2, and expression in Cluster 1 and 4 being the highest [Figure 2D].
Expression of miRNAs in group 4 was the lowest in Cluster 4 relative to the other clusters. Group 5 miRNA expression was high in Cluster 1 and 2 and low in Cluster 3 and 4. For some of these miRNAs, expression was lower in Cluster 1 vs. Cluster 2.
Demographics of different clusters
The mean age of the subjects was 43.5, and this was not different among the clusters [Table 3]. There was an overall female predominance in our population (65% female), which is consistent with the makeup of our asthma clinic from which patients were recruited. The distribution of genders did not statistically differ across the four clusters. However, Cluster 3 had a high percentage of females (75%), while Cluster 4 had a low percentage (54%). Clusters 1 and 2 were comprised predominantly of white subjects, while there was more racial diversity in Clusters 3 and 4. In Cluster 3, 45% of the subjects were black. There were only two Asian subjects in our cohort (both in Cluster 4), and three Hispanic subjects (two in Cluster 3 and one in Cluster 4).
Differences in clinical features between clusters
| Clinical feature | Cluster 1 (n = 10) | Cluster 2 (n = 20) | Cluster 3 (n = 19) | Cluster 4 (n = 13) | P-value1 |
|---|---|---|---|---|---|
| Age (year), mean (SD) | 45.6 (17.9) | 40.3 (13.5) | 42.5 (14.9) | 48.5 (13.2) | 0.440 |
| Male/female, (%female) | 4/6(60) | 8/12(60) | 4/15(79) | 6/7(54) | 0.451 |
| Race and ethnicity % (W, B, H, A) | 100, 0, 0, 0 | 95, 5, 0, 0 | 52.6, 36.8, 10.5, 0 | 61.5, 15.4, 7.7, 15.4 | 0.003 |
| BMI, mean (SD) | 31.7 (7.6) | 27.7 (5.4) | 35.1 (12.0) | 31.8 (8.4) | 0.080 |
| FVC%, mean (SD) | 92.6 (13.0) | 88.8 (14.5) | 74.3 (18.9) | 86.2 (18.3) | 0.017 |
| FEV1%, mean (SD) | 84.4 (18.9) | 74.5 (21.4) | 60.7 (19.3) | 63.5 (20.2) | 0.014 |
| FEV1/FVC, mean (SD) | 0.74 (0.13) | 0.67 (0.14) | 0.67 (0.12) | 0.59 (0.11) | 0.048 |
| ICS dose/day, mean (SD) | 250(425) | 431(416) | 752(494) | 766(344) | 0.006 |
| Total # medications, mean (SD) | 0.9 (1.3) | 2.2 (1.4) | 3.2 (1.5) | 3.5 (1.6) | < 0.001 |
| # needing > 1 controller/total (%) | 3/10 (30%) | 11/20 (55%) | 9/19 (47%) | 11/13 (85%) | |
| Asthma control score | 21.2 (5.1) | 17.7 (5.3) | 13.7 (6.2) | 12.5 (5.4) | < 0.001 |
| Eosinophils, mean (SD) | 139(99) | 317(293) | 477(401) | 284(181) | 0.072 |
| Severe asthma, % (n) | 20(2) | 35(7) | 89(17) | 77(10) | < 0.001 |
| Aeroallergen sensitivity, % (n) | 90(9) | 85(17) | 89(17) | 85(11) | |
| For allergic subjects | |||||
| Total # allergens tested positive, mean (SD) | 3.8 (3.5) | 5.5 (4.9) | 4.8 (4.5) | 6.5 (5.2) | 0.546 |
| Pollen sensitivity (%) | 50 | 45 | 58 | 54 | 0.941 |
| Cockroach sensitivity (%) | 10 | 25 | 21 | 31 | 0.693 |
| Dust mite sensitivity (%) | 60 | 50 | 47 | 54 | 0.782 |
| Animal sensitivity (%) | 30 | 45 | 68 | 46 | 0.143 |
| Mold sensitivity (%) | 10 | 45 | 32 | 38 | 0.291 |
Obesity across clusters
Our cohort of asthmatics had a high rate of obesity, consisting of 44% with body mass index (BMI) > 30, 35% with BMI 25-30, and 21% with BMI < 25. Mean BMI in Cluster 3 was the highest at 35.1(12), 31.8 (8.4) in Cluster 4, 31.7 (7.6) in Cluster 1, and the lowest in Cluster 2 at 27.7 (5.4).
Asthma severity and asthma control
Cluster 1 was comprised of mostly mild asthmatics (9/10 mild), while Cluster 3 and 4 were mostly severe asthma (18/20 and 9/13, respectively). Asthma severity in Cluster 2 was variable, and included 5 mild, 8 moderate, and 7 severe persistent asthmatics. Asthma control differed across the clusters. Cluster 1 had the best control (mean ACT of 21.2) followed by Cluster 2 (mean ACT of 17.7), Cluster 3 (mean ACT of 13.7), and Cluster 4 (mean ACT of 12.5). Asthma controller medication use, as a measure of difficult to treat asthma, also varied by cluster. Cluster 1 had the lowest daily inhaled corticosteroid (ICS) use, and Cluster 3 and 4 had the highest. In addition, Cluster 1 required the lowest number of controller medications, while Clusters 3 and 4 had the highest.
Lung function
Consistent with our observations on the relationship between clusters and asthma severity, differences in lung function were observed in different clusters. Subjects in Cluster 4 had the highest degree of obstruction (FEV1/FVC ratio of 0.59 ± 0.11), compared to 0.74 ± 0.13 in Cluster 1, 0.67 ± 0.14) in Cluster 2, and 0.67 ± 0.12 in Cluster 3. In addition, subjects in Cluster 3 had the lowest FEV1% at 60.7 ± 19.3, compared to 63.5 ± 20.2 in Cluster 4, 74.5 ± 21.4 in Cluster 2, and Cluster 1 had the highest at 84.4 ± 18.9.
Markers of type 2 inflammation
All subjects in our study had allergy testing to environmental allergies. There were similar rates of proportions of subjects with aeroallergen sensitivity (based on at least one positive test to a panel of 15 aeroallergens): Clusters 1, 2, 3, and 4 were respectively 90%, 85%, 89%, and 85%. Subjects in Cluster 1 had the lowest number of positive aeroallergen tests (mean 3.8 positive tests per person), while Cluster 4 had the highest (mean 6.8 positive tests per person), but these values did not meet statistical significance. Cluster 1 was also associated with a low rate of mold sensitivity (10% of subjects had 1 or more positive tests to mold).
The absolute number of eosinophils in blood was the highest in Cluster 3 at 477. Mean absolute eosinophils in Cluster 1 was 139, 317 in Cluster 2, and 284 in Cluster 4. The mean total IgE was the highest in Cluster 2 at 881, 588 in Cluster 2, 231 in Cluster 4, and 97 in Cluster 1. However, not all subjects had a total IgE level drawn, as this measure was only done in subjects with moderate to severe asthma, per our typical clinical workup in this patient asthma group.
Discussion
Asthma is a heterogeneous disease that exemplifies the need for personalized approaches to medicine. Because different asthma phenotypes may be driven by different mechanisms and thus respond differently to specific therapies, it is crucial to develop diagnostic approaches to identify and classify these subgroups.
In a previous study, we identified a panel of ~40 miRNAs that were differentially expressed in asthmatics vs. non-asthmatics[7]. Our previous work also demonstrated that miRNAs may provide information about the presence or absence of eosinophilic asthma, and that miRNAs upregulated in eosinophilic asthma may play roles in disease pathogenesis. In this study, we sought to further characterize these relationships to determine whether miRNA expression patterns define subgroups of asthmatics that differ by atopy, eosinophilia, severity, and clinical characteristics. Our findings demonstrate that blood miRNA expression profiles define distinct asthma phenotypes, and that expression patterns differ based on severity, BMI, and eosinophila. The importance of these findings is discussed herein.
Association of miRNA expression patterns with mild, non-eosinophilic asthma
Cluster 1 was associated with mild asthma, low ICS use, and low atopy (as assessed by number of allergens that tested positive and blood eosinophilia). In terms of miRNA expression, it correlated with low levels of the Let7 family, which also includes miR-98 (we classified these miRNAs as “group 1” based on expression pattern), as well as low levels of group 2 miRNAs, which included miR-21 and miR-155 [Figure 3]. All of these miRNAs have been shown to play roles in asthmatic inflammation. It was demonstrated that increased miR-98 in peripheral blood may contribute to pathogenesis of asthma by lowering the frequency of immune regulatory B cells[12]. There is some evidence to suggest that Let-7 has a pro-inflammatory role in asthma, primarily by promoting type 2 inflammation[13,14]. MiR-155 and miR-21 are both known to be involved in asthma pathogenesis, particularly in asthma that is associated with eosinophilia[15-18]. Inhibition of the miRNA and/or ablation of genes coding for the miRNA in mice attenuated airway inflammation and reduced tissue eosinophilia. Furthermore, miR-21 has been shown to convey steroid resistant asthma in a mouse model, by amplifying the effects of phosphoinositide 3-kinase[19]. As such, low expression of these miRNAs is congruent with the clinical observations that these subjects in this cluster have mild asthma, low eosinophil levels, and little need for corticosteroids.
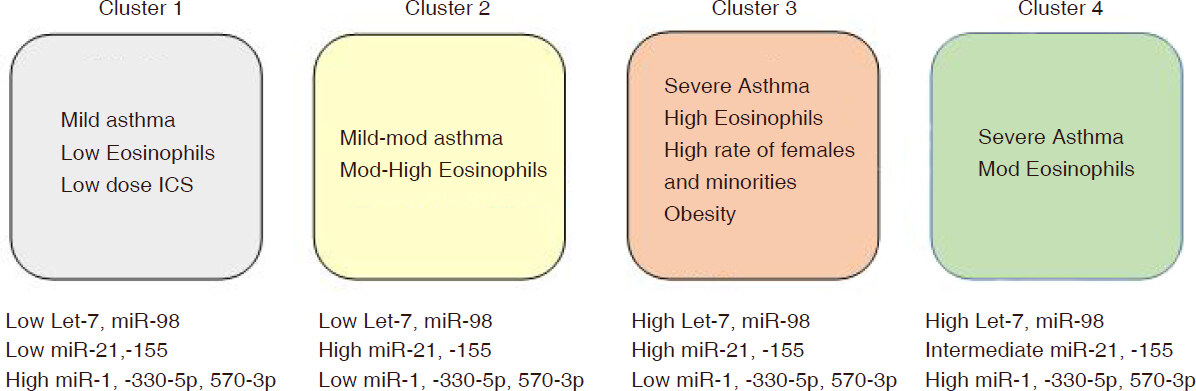
Figure 3. Clinical characteristics and miRNA expression patterns of asthma clusters. ICS: inhaled corticosteroid
Identification of miRNAs associated with increased asthma severity and eosinophilia
Based on differences in asthma severity and eosinophilia between asthma clusters, our results identified miRNA signatures associated with clinical features of disease. Expression of Let7 family and miR-98 (i.e., group 1 miRNAs) appeared to be most representative of severity; expression was the lowest in Cluster 1 (mild asthma), higher in Cluster 2 (mild-moderate asthma) and the highest in severe asthma (Cluster 3 and 4). Regarding an eosinophilic specific miRNA signature, expression of group 2 miRNAs (including miR-155 and miR-21) appeared to be the most useful to define eosinophilia, independent of severity. Expression of these miRNAs were the highest in the eosinophilic Clusters (2 and 3), and the lowest in the non-eosinophilic cluster (Cluster 1). The patterns of miRNA expression and clinical correlations are consistent with the findings in mouse studies discussed above, suggesting conserved pathways between mouse and humans. A major implication of these findings is that measurement of blood expression levels of these miRNAs at the time of asthma diagnosis could be useful in predicting outcomes and selection of treatment. For instance, patients with high levels of group 1 and group 2 miRNAs may require more aggressive treatment targeted to eosinophils, whereas those with low levels of these miRNAs may have better outcomes with need for lower doses of ICS. Prospective studies will be essential to validate these hypotheses and determine whether these miRNA signatures have predictive properties.
MiRNA expression patterns distinguish subsets of severe asthmatics
Severe asthma continues to be challenging to treat, in part because it is not clear whether there are distinct sub-phenotypes of severe asthma that require different treatment approaches. Our miRNA expression profiles identified two distinct severe asthma subpopulations, Cluster 3 and Cluster 4. While these subjects had similar levels of asthma severity, asthma control, allergic sensitization, and ICS use, Cluster 3 was associated with features that typically predict worse asthma outcomes, including higher blood eosinophil levels, higher BMI, female gender, and racial/ethnic disparity (higher rate of Black and Hispanic subjects). Thus, miRNA expression profiles may be able to detect phenotypic differences in severe asthmatics, even when these are not easily apparent based on clinical features alone. For the most part, group 2 miRNAs (including miR-21 and miR-155) were higher in Cluster 3 vs. Cluster 4 (and higher vs. Cluster 1 and Cluster 2 as well), in line with the discussion above these miRNAs are associated with severe, eosinophilic asthma in mouse models and humans.
Potential function of candidate miRNAs
Expression patterns of miRNAs in eosinophilic clusters may provide clues about the potential functions of these miRNAs in asthma. As discussed above, pro-eosinophil miRNAs (group 2 miRNAs such as miR-21 and miR-155) were elevated in clusters with highest blood eosinophil levels (Clusters 2 and 3). The finding that these clusters of asthmatics were also associated with low expression of miRNAs in group 3 (i.e., miR-1, miR-330-5p, miR-570-3p, miR-1248), raises a question about whether these miRNAs could have anti-eosinophil function. These miRNAs in fact showed an inverse relationship with blood eosinophil levels in our asthma cohort. It is possible that an imbalance between anti-eosinophilic miRNAs and pro-eosinophilic miRNAs exists in these subgroups of asthmatics. While there is ample evidence for the pro-inflammatory roles of miR-21 and miR-155, the miRNAs categorized in group 3 are poorly studied in asthma. However, there is emerging data that a number of them negatively modulate inflammation. MiR-1 has been shown to have anti-Th2 inflammatory properties in a mouse asthma model, and reduced levels in Cluster 2 and 3 of our human asthmatics could be a factor in pathogenesis of a pro-type 2 inflammatory phenotype[20]. Along similar lines, miR-330-3p has been shown to promote M1 macrophage differentiation, while its inhibition drives M2 macrophage differentiation[21]. We previously identified miR-570-3p as a candidate asthma miRNA. We found that it regulated a number of inflammatory mediators in airway epithelial cells, such that its de-regulation could also have implications in asthmatic inflammation[22]. In addition, we previously found that miR-1248 was capable of regulating IL-5, a crucial pro-eosinophilic cytokine[7]. However, the function of this miRNA has not been established in in vivo systems. Taken together, these findings suggest that expression profiles of miRNAs in asthmatics may reflect an interplay of numerous miRNAs that act in concert to skew inflammatory responses towards specific asthma phenotypes. Certainly, future work will be needed to further dissect the roles of the miRNAs in asthma and eosinophilic inflammation.
Conclusion
This work is the first to demonstrate that miRNA expression profiles are capable of identification of asthma subtypes that are clinically distinct. We propose that miRNA profiling may be a useful adjunct to the current workup of asthma. However, there are a number of limitations in our study. First, we did not have access to lower lung samples, such as sputum or bronchoalveolar lavage fluid. Ideally these sources of sample would be most accurate for determining the presence of eosinophilic airway inflammation. Second, this is a cross-sectional study. Future work will be needed to determine whether these phenotypes change over time. In addition, prospective studies will need to be done to determine whether categorizing asthmatics into these clusters has predictive value, specifically to determine whether these specific groups have different clinical outcomes and different response to asthma medications. As a number of specific medications targeting eosinophils, IgE, and specific cytokines are now available (and many more in development), miRNA expression profiles may have a useful role in helping to select the specific therapy for the specific subtype of asthma.
Declarations
Authors’ contributionsConception, design of the study, data analysis and interpretation: Zhang S, Laryea Z, Panganiban R, Lambert K, Ishmael FT
Data acquisition, provided administrative, technical, and material support: Hsu D
Availability of data and materialsData and materials are available to readers and can be obtained by contacting the corresponding author.
Financial support and sponsorshipNone.
Conflicts of interestAll authors declared that there are no conflicts of interest.
Ethical approval and consent to participateThis study was approved by the Penn State Institutional Review Board in accordance with the Declaration of Helsinki. All subjects agreed to participate in the study and provided written informed consent.
Consent for publicationNot applicable.
Copyright© The Author(s) 2018.
REFERENCES
1. World Health Organization. Global surveillance, prevention and control of chronic respiratory diseases: a comprehensive approach.Available from: http://www.who.int/gard/publications/GARD%20Book%202007.pdf. [Last accessed on 24 Oct 2018].
2. Bousquet J, Mantzouranis E, Cruz AA, Aït-Khaled N, Baena-Cagnani CE, et al. Uniform definition of asthma severity, control, and exacerbations: document presented for the World Health Organization consultation on severe asthma. J Allergy Clin Immunol 2010;126:926-38.
3. Chung KF, Wenzel SE, Brozek JL, Bush A, Castro M, et al. International ERS/ATS guidelines on definition, evaluation and treatment of severe asthma. Eur Respir J 2014;43:343-73.
4. Wenzel SE. Asthma phenotypes: the evolution from clinical to molecular approaches. Nat Med 2012;18:716-25.
5. Moore WC, Meyers DA, Wenzel SE, Teague WG, Li H, et al. Identification of asthma phenotypes using cluster analysis in the severe asthma research program. Am J Respir Crit Care Med 2010;181:315-23.
6. McGrath KW, Icitovic N, Boushey HA, Lazarus SC, Sutherland ER, et al. A large subgroup of mild-to-moderate asthma is persistently noneosinophilic. Am J Respir Crit Care Med 2012;185:612-9.
7. Panganiban RP, Wang Y, Howrylak J, Chinchilli VM, Craig TJ, et al. Circulating microRNAs as biomarkers in patients with allergic rhinitis and asthma. J Allergy Clin Immunol 2016;137:1423-32.
8. Perry MM, Adcock IM, Chung KF. Role of microRNAs in allergic asthma: present and future. Curr Opin Allergy Clin Immunol 2015;15:156-62.
10. Nathan RA, Sorkness CA, Kosinski M, Schatz M, Li JT, et al. Development of the asthma control test: a survey for assessing asthma control. J Allergy Clin Immunol 2004;113:59-65.
11. de Hoon MJ, Imoto S, Nolan J, Miyano S. Open source clustering software. Bioinformatics 2004;20:1453-4.
12. Chen L, Xu J, Chu X, Ju C. MicroRNA-98 interferes with thrombospondin 1 expression in peripheral B cells of patients with asthma. Biosci Rep 2017; doi: 10.1042/BSR20170149.
13. Kumar M, Ahmad T, Sharma A, Mabalirajan U, Kulshreshtha A, et al. Let-7 microRNA-mediated regulation of IL-13 and allergic airway inflammation. J Allergy Clin Immunol 2011;128:1077-85.
14. Polikepahad S, Knight JM, Naghavi AO, Oplt T, Creighton CJ, et al. Proinflammatory role for let-7 microRNAS in experimental asthma. J Biol Chem 2010;285:30139-49.
15. Lee HY, Choi JY, Hur J, Kim IK, Kim YK, et al. Inhibition of MicroRNA-21 by an antagomir ameliorates allergic inflammation in a mouse model of asthma. Exp Lung Res 2017;43:109-19.
16. Qiu L, Zhang Y, Do DC, Ke X, Zhang S, et al. miR-155 modulates cockroach allergen- and oxidative stress-induced cyclooxygenase-2 in asthma. J Immunol 2018;201:916-29.
17. Daniel E, Roff A, Hsu MH, Panganiban R, Lambert K, et al. Effects of allergic stimulation and glucocorticoids on miR-155 in CD4+ T-cells. Am J Clin Exp Immunol 2018;7:57-66.
18. Malmhäll C, Alawieh S, Lu Y, Sjöstrand M, Bossios A, et al. MicroRNA-155 is essential for T(H)2-mediated allergen-induced eosinophilic inflammation in the lung. J Allergy Clin Immunol 2014;133:1429-38.
19. Kim RY, Horvat JC, Pinkerton JW, Starkey MR, Essilfie AT, et al. MicroRNA-21 drives severe, steroid-insensitive experimental asthma by amplifying phosphoinositide 3-kinase-mediated suppression of histone deacetylase 2. J Allergy Clin Immunol 2017;139:519-32.
20. Takyar S, Vasavada H, Zhang JG, Ahangari F, Niu N, et al. VEGF controls lung Th2 inflammation via the miR-1-Mpl (myeloproliferative leukemia virus oncogene)-P-selectin axis. J Exp Med 2013;210:1993-2010.
21. Sun J, Huang Q, Li S, Meng F, Li X, et al. miR-330-5p/Tim-3 axis regulates macrophage M2 polarization and insulin resistance in diabetes mice. Mol Immunol 2018;95:107-13.
Cite This Article
Export citation file: BibTeX | RIS
OAE Style
Zhang S, Laryea Z, Panganiban R, Lambert K, Hsu D, Ishmael FT. Plasma microRNA profiles identify distinct clinical phenotypes in human asthmatics. J Transl Genet Genom 2018;2:18. http://dx.doi.org/10.20517/jtgg.2018.22
AMA Style
Zhang S, Laryea Z, Panganiban R, Lambert K, Hsu D, Ishmael FT. Plasma microRNA profiles identify distinct clinical phenotypes in human asthmatics. Journal of Translational Genetics and Genomics. 2018; 2: 18. http://dx.doi.org/10.20517/jtgg.2018.22
Chicago/Turabian Style
Zhang, Simin, Zoe Laryea, Ronaldo Panganiban, Kristin Lambert, Diana Hsu, Faoud T. Ishmael. 2018. "Plasma microRNA profiles identify distinct clinical phenotypes in human asthmatics" Journal of Translational Genetics and Genomics. 2: 18. http://dx.doi.org/10.20517/jtgg.2018.22
ACS Style
Zhang, S.; Laryea Z.; Panganiban R.; Lambert K.; Hsu D.; Ishmael FT. Plasma microRNA profiles identify distinct clinical phenotypes in human asthmatics. J. Transl. Genet. Genom. 2018, 2, 18. http://dx.doi.org/10.20517/jtgg.2018.22
About This Article
Special Issue
Copyright

Data & Comments
Data


 Cite This Article 4 clicks

 Like This Article 0
likes
Like This Article 0
likes


Comments
Comments must be written in English. Spam, offensive content, impersonation, and private information will not be permitted. If any comment is reported and identified as inappropriate content by OAE staff, the comment will be removed without notice. If you have any queries or need any help, please contact us at support@oaepublish.com.