
Toward uncharted territory of cellular heterogeneity: advances and applications of single-cell RNA-seq


Abstract
Among single-cell analysis technologies, single-cell RNA-seq (scRNA-seq) has been one of the front runners in technical inventions. Since its induction, scRNA-seq has been well received and undergone many fast-paced technical improvements in cDNA synthesis and amplification, processing and alignment of next generation sequencing reads, differentially expressed gene calling, cell clustering, subpopulation identification, and developmental trajectory prediction. scRNA-seq has been exponentially applied to study global transcriptional profiles in all cell types in humans and animal models, healthy or with diseases, including cancer. Accumulative novel subtypes and rare subpopulations have been discovered as potential underlying mechanisms of stochasticity, differentiation, proliferation, tumorigenesis, and aging. scRNA-seq has gradually revealed the uncharted territory of cellular heterogeneity in transcriptomes and developed novel therapeutic approaches for biomedical applications. This review of the advancement of scRNA-seq methods provides an exploratory guide of the quickly evolving technical landscape and insights of focused features and strengths in each prominent area of progress.
Keywords
Introduction
Homogeneity and heterogeneity are proportionally co-existent in all phenotypical and genetic levels of humans. The extent of heterogeneity is increased from individuals down to molecules, whereas homogeneity is decreased [Figure 1A]. The diversity is observed in individuals, organs, tissues, cells, organelles, and molecules, and even more abundant in protein, DNA, and RNA molecules. The long-standing paradigm that cells of the same tissue origin are homogeneous based on bulk cell studies has lately been challenged by single-cell studies[1-5]. New data show that cells arising from the same tissue origins are far more heterogeneous than they seemingly appear [Figure 1B][6-8]. Even genetically identical cells cultured in the same conditions have shown variations in gene expression[9,10].
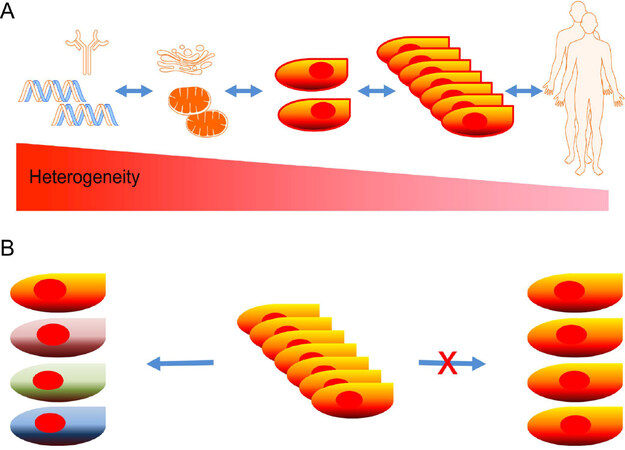
Figure 1. A new paradigm for cellular heterogeneity: heterogeneity and homology coexistent in all levels of phenotypes and genotypes in humans, as heterogeneity is increased from individual level down to molecular level (A); a new paradigm predicts that cells from the same tissue are not created equally and heterogeneity of cells are far more than we previously perceived based on bulk studies (B)
In the new paradigm, the diverse properties of cells are mainly reflected in the heterogeneous gene expression, genomic alterations, epigenomic modifications, and proteomic fluctuations[7,11-16]. Cellular transcriptomic heterogeneity helped to establish a new paradigm of cellular heterogeneity with the invention of scRNA-seq[17-19]. The cellular transcriptomic heterogeneity arises from stochasticity, differentiation, environmental stimuli, diseases, aging, and other factors[5,8,11,20-23]. The development of single-cell analysis was overshadowed by traditional bulk cell approaches and technically limited by the absence of high throughput single-cell isolation and minute initiation materials (picogram DNA and mRNA per cell)[3]. Combined technological advances in cell isolation, high throughput multiplexing, amplification, and next generation sequencing facilitated scRNA-seq and uncovered cellular heterogeneity[24]. Mapping transcriptomic changes at single-cell level has since revealed global gene expression profiles and exposed stochasticity, differentiation, cell fate plasticity, and diseases[25]. In this review, we highlight the novel scRNA-seq platforms and conduct a comparative analysis of each technology and their future applications in translational science.
Single-cell isolation technologies
Cell purity is paramount for scRNA-seq and other single-cell analysis methods. Tissues, organoids, and 2D and 3D cultured cells are multi-cellular, and the first step to dissociate aggregated cells into individual cells risks potential contamination with cell doublets, DNA, and RNA by incomplete enzymatic digestion and cell lysis. The impurity of single cells distorts the scRNA-seq data and leads to false interpretations. To ensure the purity and integrity of single cells, several instrumental technologies have been adopted to overcome these technical challenges.
Manual cell picking (micromanipulation)
Manual cell picking presents a simple and cost-effective method for single-cell isolation. This technique involves an inverted fluorescent microscope, manipulator, and microinjector for precise cell location and picking after cells are labeled with markers[26]. The instrumental efficiency of picking individual cells exceeds old-fashioned mouth-pipetting[17]. Specifically, cells are maintained in suspension and manually isolated by capillary pipettes connected with a microinjector. Cellular integrity is maintained for further analysis and is particularly workable with rare cells. However, high operator skills are required through training and practice. Additionally, the throughput is relatively low compared with the other methods[27].
Flow activated cell sorting
This high throughput method relies on antibody affinity to cell surface markers and has become the most common strategy for single-cell isolation. Cells are labeled with fluorescent or conjugated antibodies and run through flow cytometry, sensed by laser detectors or a magnetic field, and sorted with surface specific markers[27,28]. With advanced fluorochrome and microscope techniques, 18 fluorescent, inorganic semiconductor nanocrystals (Quantum Dots) are used to label antigens on cells, which increases the specificity and sensitivity of single-cell isolation from a bulk sample[29,30]. However, greater than 10,000 cells are required for this method and signal overlap may affect the purity of the target cells. Moreover, this method cannot perform single-cell analysis with rare cells.
Microfluidic technology
This technology for single-cell isolation can be divided into three main approaches: droplet-based microfluidics, channel-based microfluidics, and hydrodynamic traps. These methods rely on cell adhesion, hydrodynamics, physical characteristics (e.g., size and shape), cellular density, and elasticity. Microfluidic technology platforms can actively or passively recognize and sort single cells from a heterogenic population[31]. In droplet-based microfluidics, each single cell is embedded in a hydrophilic droplet which suspends hydrophobic channels. The advantages of this approach are high throughput and yield, making it feasible to isolate rare cell types[32]. Besides, genetic barcodes can be added within the cell droplet that record the cell origin, allowing profiling of cells from simultaneous preparation of thousands of single-cell libraries[33,34]. In channel-based microfluidics, single cell is controlled and confined by pneumatic membrane valves according to the biological requirements. This selection approach increases the accuracy of cell isolation and the flexibility of experimental design. However, it is limited by the low throughput compared with droplet-based microfluidics. Hydrodynamic traps such as Fluidigm C1 passively isolate and trap single cells based on cell size[31,32]. Both channel-based microfluidics and hydrodynamic traps enable long-term cell culture and high-resolution observation for further biological experiments such as drug treatment or cDNA library preparation[35].
Laser capture microdissection
This microscopy-based technology carries out isolation of specific single cells on a microscope slide without cell dissociation from solid samples. Tissue sections are either top-covered by or laid on a thermoplastic polymer film, which is heat-activated by infrared or ultraviolet laser. The boundaries of a single cell on a tissue section are recognized and severed precisely by laser, and the dissected cell is captured[36,37]. Laser capture microdissection is a rapid and precise isolation technology that maintains versatility for further analysis including scRNA-seq[38,39].
Technical advances for cDNA synthesis and amplification
The uniform and full coverage of cDNA synthesis from single-cell mRNA/RNA is a crucial step for the success of scRNA-seq because the limited starting materials are as little as 5-30 pg and need to be amplified for next generation sequencing. The cDNA synthesis from single cells has been attempted for qRT-PCR and microarrays, and the technical predecessors were adopted and modified for scRNA-seq[40,41]. The protocols of scRNA-seq have fruitfully advanced in a decade [Table 1][19,25,42-44]. The technical variations have strengths and weaknesses in linear amplification, length coverage, low copy RNA species detection, multiplexing, high throughputs, and cost reduction. Tang’s protocol was the first scRNA-seq modality and was based on single-cell RNA amplification from RNA microarray assays[45,46]. Tang’s protocol uses poly(T) primers to generate full-length cDNA of transcripts less than 3 kb and can detect ~13,000 genes, 65% of microarray genes[42]. Two years later, Single-cell Tagged Reverse Transcription sequencing (STRT-seq) introduced template switching to incorporate bead-linked barcoded primers for strand-specific amplification of 3’ ends and high throughput 96-cell multiplexing with 2000-4000 genes detected in individual cells[18,47,48]. In 2012, a significant advancement for full-length cDNA synthesis of 40% transcripts was made with Smart-seq, and it was updated with the Smart-seq2 in 2013[49-51]. Smart-seq has laid the foundation for future scRNA-seq methods, employing more stable template switching ribo(guanosine)3 oligos and having more unique mapping reads, higher recovery rates of low expression genes, and a two-fold increase in spliced forms discovered. At about the same time, Cell Expression by Linear amplification and sequencing (CEL-seq) utilized linear strand-specific in vitro transcript amplification mainly at 3’ ends, and an improved CEL-seq2 version reduced mRNA molecule counting biases with the introduction of unique molecular identifiers (UMIs)[52-55]. Single Cell RNA Barcoding and sequencing (SCRB-seq) is a protocol for high throughput of 12,000 cells at a low cost and one of the first scRNA-seq protocols to include UMIs[56]. Previous scRNA-seq platforms utilized relative measures such as reads per kilobase per million reads (RPKM), which masked differences in total mRNA content. As an example, a gene may be “upregulated” in terms of RPKM and have a decrease in absolute expression level. UMIs are short unique sequences integrated in cDNAs before PCR amplification to allow for unique identification of amplified DNAs carrying the same UMI sharing the same mRNA/RNA molecule origin and reduce nonlinear PCR amplification bias. For full length transcript coverage and analysis of noncoding RNA, Multiple Annealing and dC-Tailing-based Quantitative single-cell RNA-seq (MATQ-seq) and Random Displacement Amplification sequencing (RamDA-seq) can be employed, which allow for poly(A)+ and non-poly(A) scRNA-seq, useful for characterization of lncRNA or circRNA[57-59]. RamDA-seq also detects enhancer RNAs differentially expressed in a cell-type specific manner. Quartz-Seq builds upon both CEL-seq2 and STRT-seq to perform 3’ coverage scRNA-seq, vastly improving poly(A) tailing and initial read UMI conversion and augmenting sequencing depth and accuracy[60].
cDNA synthesis and amplification techniques for scRNAseq
| Methods | coverage | UMI | Strand specific | cDNA synthesis | Detected genes | Ref. |
|---|---|---|---|---|---|---|
| Tang’s | Nearly full-length | No | No | poly(T) primer | 13K | Tang et al.[43], 2009 |
| STRT-seq and STRT/C1 | 3’ and 5’-only | Yes | Yes | tailed oligo-dT primer; a barcoded r(G)3 helper oligo primer | ~2-4K | Islam et al.[18,48], 2011, 2014 |
| Smart-seq | Full-length | No | No | tailed oligo(dT) priming using the CDS primer | ~8K | Ramsköld et al.[49], 2012 |
| CEL-seq (CEL-seq2) | 3’-only | Yes | Yes | 8bp-barcoded poly(T) primer | ~5K | Hashimshony et al.[54,55], 2012; 2016 |
| Smart-seq2 | Full-length | No | No | tailed oligo(dT) priming using the CDS primer | ~10K | Picelli et al.[50,51], 2013; 2014 |
| Quartz-Seq | Full-length | No | No | poly(T) primer | 5.8-6.3K | Sasagawa et al.[60], 2013 |
| DP-seq | 3’-only | No | No | hexamer | 11K transcripts | Bhargava et al.[69], 2013 |
| SCRB-seq | 3’ only | Yes | Yes | cell-barcoded UMI-Poly(T) primer | 3k transcripts | Soumillon et al.[56], 2014 |
| MARS-seq | 3’-only | Yes | Yes | barcoded Poly(T) primer | ~200-1500 transcripts | Jaitin et al.[61], 2014 |
| Drop-seq | 3’-only | Yes | Yes | bead-based barcoded UMI-poly(T) primer | 6-7K genes | Macosko et al.[33], 2015 |
| InDrop | 3’-only | Yes | Yes | hydrogel sphere encapped cell barcoded UMI-poly(T) | 29K UMIFM | Klein et al.[34], 2015 |
| SUPeR-seq | Full-length | No | No | random
(AnchorX-T15N6) primers | ~10K | Fan et al.[65,186], 2015 |
| CytoSeq | 3’-only | Yes | Yes | Illumina universal PCR primer & cell UMI-Poly(T) | ~100 | Fan et al.[65], 2015 |
| SC3-seq | 3’ only | No | No | V1(dT)24 | 4-6K | Nakamura et al.[70], 2015 |
| MATQ-seq | Full-length | Yes | Yes | GATdT primers; MALBAC primers | ~14K | Sheng et al.[57], 2017 |
| Chromium | 3’-only | Yes | Yes | Gel bead based 14x GEM index-10x barcoded-poly(T) primer | ~500 | Zheng et al.[63], 2017 |
| SPLiT-seq | 3’-only | Yes | Yes | random hexamer and anchored poly(dT)15 barcoded RT primers | 4.5.-5.5K | Rosenberg et al.[68], 2018 |
| sci-RNA-seq | 3’-only | Yes | Yes | 10bp barcoded-8bp UMI- Poly (T)30 primer | 4-5.5K | Cao et al.[67], 2017 |
| Seq-Well | 3’-only | Yes | Yes | bead-based 12bp barcoded 8bp UMI- Poly(T)30 primer | 6-7K | Gierahn et al.[64], 2017 |
| DroNC-seq | 3’-only | Yes | Yes | bead-based barcoded UMI-poly(T) primer | 1.7-3.3K | Habib et al.[66], 2017 |
| Quartz-Seq2 | 3’-only | Yes | Yes | cell-barcoded UMI-poly(T) primer (v3.1: 73-mer) | 8K | Sasagawa et al.[187], 2018 |
Many methods employ cDNA amplification strategies, as mentioned above, but they each have unique methods of single-cell sorting and significant high throughput improvement. MAssively parallel RNA Single-cell sequencing (MARS-seq) uses fluorescence-activated cell sorting sorting to separate and sort 100-1000 cells into individual wells[61]. Drop-seq and InDrop are two similar methods that employ droplet capture microfluidic methods to isolate cells. The main differences are that Drop-seq uses reagent containing beads, while InDrop uses reagent carrying hydrogel microspheres. Both platforms can quickly process tens of thousands of cells daily[33,34]. Chromium is similar to both previous methods, employing a gel bead in emulsion[62] microfluidic capture method, but has the advantage of being able to process eight samples at once or a single sample more quickly due to its eight-channel microfluidic chip[63]. Seq-Well is a low-cost alternative, not requiring any expensive microfluidic devices and instead utilizing semi-permeable membranes on a picowell plate with wells that contain one barcoded capture bead and space for one single cell per well[64]. Seq-Well plates have ~86,000 wells, but the actual capture efficiency varies. Similar to the other platforms (CEL-seq, STRT-seq, and SCRB-seq), CytoSeq employs a microfluidic method automating high throughput cell settling in 1/10 of 100,000-well plate by gravity[65]. It employs a similar plate system to Seq-Well with 30-µm well sizes only allowing one cell per well and one magnetic bead with a universal primer plus 106 diverse UMIs created by a split-pool synthesis process. It can easily reach up to 10,000 cells with detection of ~100 genes per cell.
For harder to work with tissues, such as frozen samples, DroNC-seq is able to salvage samples and produce high quality data, employing single nucleus RNA-seq with 3’ coverage[66]. sci-RNA-seq performs the analysis of single cells or nuclei isolated from methanol-fixed whole organisms (~50,000 cells), with 3’ coverage and high depth sequencing employing double UMI barcoding[67]. Split-Pool Ligation-based Transcriptome sequencing (SPLiT-seq) is an extremely high throughput 3’ coverage method distinct from other methods, offering scRNA-seq analysis without single-cell isolation from 1.33% formaldehyde-fixed tissues[68]. It employs combinatorial indexing to identify single cells without isolation, by performing three successive barcoding steps through in situ reverse transcription on groups of cells and mixing after each time, leaving each cell with a unique identifier totaling up to 21 million for downstream data analysis. This invention posits potential cost reduction per cell and time effectiveness.
Not all methods employ UMIs. Designed Primer-based RNA-sequencing (DP-seq) is a 3’ coverage method useful for small samples, analyzes at least 50 pg of RNA, and employs random hexamer-based amplification and sequencing[69]. The protocol requires knowledge of the intended target’s genome prior to use. SC3-seq provides 3’ coverage method for only 3’ end characterization of mRNA, allowing for higher reproducibility and reduced noise, thus it is useful for projects not requiring deep sequencing with a low budget[46,70].
Attempts have been made to evaluate diverse scRNA-seq protocols using systematic comparisons[71]. Six commonly used methods - CEL-seq2, Drop-seq, MARS-seq, SCRB-seq, Smart-seq, and Smart-seq2 - were performed side by side using mouse embryonic stem cells. Overall, Smart-seq2 detected the most genes per cell, while the other methods displayed less amplification noise due to the use of UMIs. Power analysis showed that Drop-seq provides a less costly option for a larger number of cells analyzed, whereas MARS-seq, SCRB-seq, and Smart-seq2 were suitable for fewer cells. To evaluate sensitivity and accuracy as performance metrices for 15 different methods, in silico power analysis of External RNA Controls Consortium spike-in standards was performed in those scRNA-seq studies[72]. The vast majority of methods displayed high accuracy. The exceptions were CEL-seq and MARS-seq data, which show more variations among cells. Better sensitivity appeared in SMARTer (C1), CEL-Seq2 (C1), STRT-Seq, and InDrop-seq that could detect digital copies of spike-ins; however, the sensitivity was sequencing depth-dependent. For the droplet-based high-throughput platforms (InDrop, Drop-seq, and 10x Genomics Chromium), a thorough comparative study revealed insights regarding their efficacy and limits[73]. The 10X Genomics Chromium protocol was maturely developed with a higher cost and delivered high degree of sensitivity and accuracy with less technical noise. Drop-seq provided similar data quality with fewer cells, but a more affordable cost. InDrop is also less expensive with high compatibility with other protocols, such as Smart-seq2. In a large-scale validation of 13 protocols by multi-centered collaboration effort using mixed human and murine cells, CEL-seq2, Quartz-seq2, SMAR-seq2, and Chromium platforms were superior in producing high-resolution transcriptomic profiles[74].
Processing of next generation sequencing data of scRNA-seq
Synthesized and amplified cDNAs are subsequently subject to library preparation and NGS to generate massive sequencing short reads, as depicted in Figure 2. The current state-of-the-art computational tools and algorithms widely used in bulk RNA-seq analysis can be extended for processing scRNA-seq data. However, the transcriptome at single-cell resolution presents specific analytical challenges, which requires dedicated analytical power and specific packages. Some of the key challenges encountered during single-cell transcriptional data analysis includes greater dimensionality, high level of noise, absence of biological replicates, and data sparsity[44,75]. However, major efforts in the development of advanced algorithms and computational strategies as well as adaptations of existing workflows have shown great promise for comprehensive and detailed analysis of scRNA-seq data [Table 2]. Several programming- (R- or Python-based) and web interface-based toolkits have been proposed to facilitate systematic analysis that can be scaled up as per requirements[75,76]. Seurat[77,78] and Single Cell ANalysis in PYthon[79] are the two most comprehensive packages that can, respectively, integrate scRNA-seq data with other single-cell data and enable scaling-up to simultaneously analyze millions of cells at the same time. Of note, the core analysis pipelines show higher resemblance with the bulk RNA-seq and can be broadly categorized in the following: (1) quality control; (2) read alignment and generation of counts; (3) removal of confounding factors; and (4) normalization and annotation of cell types and cellular states. The quality of individual single-cell libraries needs to be carefully assessed to abolish the underlying noise as downstream interpretation relies heavily on the preprocessing steps. Generic quality control (QC) metrics including FastQC (http://www.bioinformatics.babraham.ac.uk/projects/fastqc/), High-Throughput Quality Control[80], or Kraken[81] provide insights into overall quality of raw sequence files. Characterization of heterogeneity is one of the primary purposes of performing single-cell analysis, however not all outliers contribute to unique cell populations. Single-cell specific quality evaluation tools such as SinQC[82], SCell[83], and Celloline[84] enable identification of technical artifacts that interfere with gene expression patterns. Mapping sequencing reads to a reference genome or transcriptome allows identification of the specific location from which the transcripts originate and subsequent quantification. Although dedicated mappers for scRNA-seq are not available, existing aligners such as TopHat[85], STAR[86], and Hierarchical Indexing for Spliced Alignment of Transcripts[87] have shown considerable precision and accuracy. Recently, two pseudo-alignment tools, Kallisto[88] and Salmon[89], have been proposed which pseudo-align splicing isoforms to a reference transcriptome and overcome the requirement of significant amount of computational power and time to process the reads. An improved Salmon with Selective Alignment and expanded decoy sequences was introduced recently and significantly reduced false mappings[90]. However, careful consideration should be made while implementing pseudo-alignment with scRNA-seq data since the data themselves can have lower depth in the first place and 3’ coverage bias. Another important step in the analysis pipeline is normalization of the expression data, which is particularly important in single-cell analysis as many technical parameters including cell capture efficiency, drop out events, read depth, and coverage bias can induce variation[91,92]. Tagging individual RNA molecules using UMIs enables absolute quantification of the transcripts from each cell. In the cases without the use of UMIs, external spike-in RNAs (i.e., ERCCs) can be used as internal controls. Additionally, several single-cell specific normalization approaches including SAMstrt[93], Bayesian Analysis of Single-Cell Sequencing (BASiCS)[94], Gamma Regression Model[95], sctransform[92], Scran[96], SCnorm[97], and Linnorm[98] can be utilized, of which the last three do not require incorporation of additional spike-ins. Eight commonly applied normalization methods (trimmed mean of M-values[99], count-per-million[100], and DESeq2[101], as well as others tailored for scRNA-seq, namely scone, BASiCS, SCnorm, Linnorm, and scran) were subject to benchmarking[102]. Data show that scRNA-seq normalization methods outperformed bulk RNA-seq counterparts. However, a bulk RNA-seq normalization method using Differentially Expressed Genes Elimination Strategy is competitive with scRNA-seq normalization methods[103,104]. Three scRNA-seq imputation methods, namely K-Nearest Neighbor smoothing (kNN-smoothing)[105], DrImpute[106], and Single-cell Analysis Via Expression Recovery (SAVER)[107], were evaluated for their capacity to tackle the zero-inflation issue either derived from a technical contribution or a normal distribution[102,108,109][Table 2]. Both kNN-smoothing and DrImpute analysis gave more reliable results compared with SAVER.
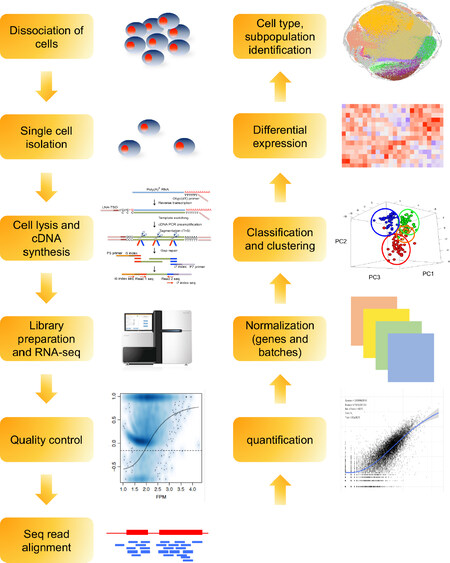
Figure 2. Schematic illustration of scRNA-seq analysis
NGS data analysis tools and software for scRNA-seq
Single-cell RNA isolation at different time points or in different laboratories can induce systemic variations and batch effects which may compromise biologically meaningful interpretation of signals[110,111]. Batch correcting algorithms such as Mutual Nearest Neighbors Correct[111], Seurat 3[112], Harmony[113], scGen, and scMerge[114], among many others, can compensate the discrepancy. In unsynchronized cells, cell-cycle variation can also mask other important physiological variations, which can be overcome by eliminating cell-cycle factors using packages such as single-cell Latent Variable Model (scLVM)[115] and ccRemover[116]. Drop-out, high number of zero counts, sparsity, and multimodality are some of the unique events encountered in single-cell expression analysis which demand more sophisticated algorithms for identifying differentially expressed genes (DEGs)[117].
Algorithms for scRNA-seq data analysis
Algorithms for scRNA-seq data analysis have been developed recently in different computer languages, such as R program or Python, and few are designed as a website interface or software package [Table 3]. scRNA-seq data are high-dimensional datasets among a great number of cells. Therefore, application of appropriate algorithms is necessary to have better analysis and visualization of scRNA-seq data. After QC and normalization, scRNA-seq data can be processed using diverse algorithms according to variant purposes, such as investigation of DEGs, identification of cell subpopulations, and cell fate trajectories (pseudotime analysis), which are the most common methods to process scRNA-seq data. Visualizations of scRNA-seq data are also diverse. The heatmap is the most common method to present DEGs between groups or within different cell types. Heatmaps are generated by most algorithms for DEGs analysis. T-distributed stochastic neighbor embedding (tSNE), scatter plot, and uniform manifold approximation, and projection (UMAP) are used for visualization of dimension reduction results in cell clustering or cell subpopulations[118-120].
Software/packages for single-cell RNA-seq analysis: differential expression, subpopulation identification, clustering, and peudotime projection
| Software/package | Differential expression | Clustering cell type | Cell fate trajectories | Language | Programing skill | Ref. |
|---|---|---|---|---|---|---|
| PAGODA | Yes | Yes | No | R | +++ | [133] |
| SCDE | Yes | No | No | R | +++ | [132] |
| Seurat | Yes | Yes | No | R | +++ | [77,112] |
| SCENIC | Yes | Yes | No | R or Python | +++ | [132] |
| Destiny | No | Yes | Yes | R | ++ | [206] |
| TSCAN | Yes | no | Yes | R or website interface | + | [147] |
| Monocle 3 | Yes | Yes | Yes | R | +++ | [123] |
| Waterfall | Yes | no | Yes | R | +++ | [150] |
| Wishbone | No | No | Yes | Python | +++ | [29] |
| GrandPrix | No | Yes | Yes | Python | +++ | [207] |
| DPT | No | No | Yes | R or Python | +++ | [144] |
| SCUBA | No | Yes | Yes | MATLAB | + | [151] |
| STREAM | No | Yes | Yes | Python | +++ | [145] |
| Slingshot | Yes | Yes | Yes | R | +++ | [148] |
| CellRouter | Yes | Yes | Yes | R | +++ | [208] |
Cell clustering and subpopulation identification
Cell clustering and cell type identification are critical features of scRNA-seq and, unlike bulk cell RNA-seq, can reveal heterogeneous cell types using entire transcriptomes from an enormous quantity of cells[25,44,121]. Recently, many software algorithms have been developed to achieve cell clustering and cell type identification [Table 3] through unsupervised dimensionality reduction based on principal component analysis (PCA), tSNE, or diffusion maps[28,122]. Based on an unsupervised clustering method, such as Seurat or Monocle 3, novel cell types or populations might be revealed with scRNA-seq data[77,78,123]. Recently, cell type identification of scRNA-seq data has been exponentially applied to studies in developmental biology, neurology, cancer biology, and immunology and can provide the type, quantity, and gene signature of different cell populations[124-129].
Differential expression analysis
Differential expression analysis can reveal significant DEGs to identify novel pathways or biological functions in different cell types or treatments. Identification of DEGs can be performed by comparing gene expression between two predetermined groups or treatments. For example, Horning et al.[130] identified a group of cell-cycle genes upregulated in a subpopulation which had an attenuated androgen response using Single Cell Differential Expression (SCDE) algorithm in R program. DEGs can also be identified among different cell types in a tissue or organ based on unsupervised algorithms, such as Seurat or Monocle 3. Wang et al.[131] identified single-cell transcriptome profiling of cardiopharyngeal lineages and characterized their cell fate using Seurat package in R program. SCDE[132], PAthway and Gene[133] set OverDispersion Analysis (PAGODA), Model-based Analysis of Single-cell Transcriptomics, Monocle, and SigEMD[134] algorithms and SINgle CEll RNA-seq profiling Analysis[135] workflows have addressed some common challenges to some extent and improved sensitivity in calling DEGs. Since each single cell has the potential to behave as a unique entity, oftentimes the curse of high dimensionality can impose restrictions in clustering and data visualization[122]. UMAP, Zero Inflated Factor Analysis, Single-cell Interpretation via Multikernel LeaRning, and scvis belong to recent dimensionality reduction techniques that can address the underlying confounding factors and enable proper visualization of diverse expression patterns over conventional PCA analysis[120,136,137]. With the advent of automated advanced tools and packages including SingleR and scMatch, cell-type annotations have significantly improved, leading to the identification of rare events or specific cell populations with the ability to scale-up[138-140]. Cell BLAST is a cell type query algorithm for the analysis of new scRNA-seq data. It utilizes a neural network-based generative model to extract low-dimensional cell-to-cell relationships from high-dimensional transcriptomic data and predicts cell types via batch correction with a large-scale curated reference cell type database[141].
Cell lineage and cell fate reconstruction
Following cell type identification, cell fate trajectory is the next step to uncover how different cell types coordinate in many aspects of biology including the developmental process or cancer progression[142,143]. Based on transcriptome information, some algorithms provide a pseudotime scale and cell fate branches within all the cells to reveal potential progression or direction of cell types based on cell phenotypic clusters[123,144]. Cell fate trajectory analysis provides an opportunity to investigate the dynamic processes of large-scale cells in developmental processes, cellular differentiation, or drug responses[145,146]. Several software packages can perform trajectory inference. Monocle 3[123], Diffusion PseudoTime[144], and Single-cell Trajectories Reconstruction, Exploration And Mapping[145] are well-developed algorithms to perform cell fate trajectory prediction but require a mastery of computer programming skills. Tools for Single Cell ANalysis (TSCAN) provides a friendly webpage interface to access and perform cell fate trajectory[147].
Of note, transcriptional dynamics represent an important feature of single-cell analysis which enables the analysis of gene expression in given time series such that the output can generate biological signals inferring potential cellular lineages. Seurat[77,78], Slingshot[148], Monocle 2[149], Waterfall[150], Single-cell Clustering Using Bifurcation Analysis[151], and TSCAN[147] can allow construction of pseudotime trajectory and assessment of expression kinetics that can provide novel insights into cellular differentiation of stem cells as well as oncogenic progression during tumor development. Tian et al.[102] evaluated five trajectory analysis methods in a thorough combination of normalization and imputation of four independent scRNA-seq datasets and found that Slingshot and Monocle 2 led to more robust results. Integration of single-cell transcriptome profiling with other single-cell or bulk analysis and spatial measurements can significantly enhance our understanding of molecular basis of cellular heterogeneity[77] and crosstalk among cellular populations in in-vivo studies[152,153].
Applications of scRNA-seq
Heterogeneity of cell fate determination in embryogenesis
In the last decade, cumulative efforts have been undertaken to explore the uncharted territory of cellular heterogeneity in different species, organs, tissues, developmental stages, and microenvironments. The first attempt was to interrogate the transitional transcription profiles in the formation of pluripotent embryonic stem cells (ESCs) in early embryogenesis[17]. The differentiational modulation from the inner cell mass to blastocysts and ESCs was not fully understood based on bulk cell studies, but they provided a good initial model for scRNA-seq analysis[17,154]. DEGs showed self-renewal and pluripotency signals with high gene expression variations, particularly for genes with medium expression levels. While epigenetic repressor expression was increased, a suppressive transcription became apparent during the development. A group of miRNAs targeting early differentiation genes and pluripotency genes plays a role in transcriptional alterations. Meanwhile, many spliced forms were discovered for the first time. The same approach was also applied to profile the transcriptional dynamics of earlier embryonic stages, preimplantation human embryos, using 124 cells from oocyte to blastocyst stage[155]. Previous bulk studies have shown that the expressions of ~1900 genes were mainly transcriptionally suppressed during the stages. In this study, about 2,495 and 2,675 genes were significantly up- and downregulated between the four- and eight-cell stages. Splicing isoforms of 4,822 transcripts were enriched in different stages and 20% of transcripts displayed more than two splicing variants. FOXP1 with exon 18b transcripts, ESC-specific splicing species, are 25-fold more abundant than those with exon 18a in undifferentiated ESCs. From the 90 single embryonic cells analyzed, 64% of the total known human lncRNAs (28,640) were found to be expressed. Another study using Smart-seq method with deep sequencing analyzed the cell fate determination between two- and four-cell embryos and later stage blastomeres[156]. However, this scRNA-seq study discovered that dozens of protein-encoding genes, including Gadd45a, showed significant differential bimodal expression between blastomeres at two- and four-cell embryonic stages. Differential monoallelic expression in 24% genes was clearly observed to be independently regulated in early embryonic development using scRNA-seq[157]. In later embryonic developmental stages within 5-7 days, X-chromosome dose compensation was found in single-cell transcriptomes of 1,529 individual cells from 88 human preimplantation embryos[158]. The cell lineage expression patterns were concurrent as an intermediate status before the establishment of the trophectoderm, epiblast, and primitive endoderm lineages that are contemporary with blastocyst formation. Linnarson’s group studied the differential expression between mouse embryonic stem cells and fibroblasts with a high throughput scRNA-seq method[18]. Nematode embryogenesis between two- and eight-cell stage was dissected with CEL-seq with RNA linear amplification by scoring single-cell transcriptomes[54]. Seventeen genes had significant two-fold mean difference between AB and P1 cells. EMS had more genes expressed compared to P2 cells, while P3 had fewer new genes expressed than C lineage. Taken together, the single-cell transcriptome data map the cell fates in early embryonic differentiation and ESC pluripotency establishment.
Heterogeneity in complex differentiated tissues and systems
With multiplexing and high throughputs improvements, scRNA-seq has served as a molecular scalpel directed at the heterogeneity of cells in much more complex tissues, systems, and organisms. The immune system is a complex of bone-marrow-derived differentiated cells. More and more scRNA-seq technologies are adopted for exploring transcriptomes and functional relevance in this biological system[159]. Dendric cells (DCs) are a group of highly heterogeneous antigen-presenting cells and important for pathogen recognition and immune defense[160]. The bulk RNA-seq of marker-sorted subpopulations did not sufficiently capture their complex functions and led to great controversy[161]. An unbiased global transcriptomic mapping of 18 bone-marrow-derived DCs exposed to lipopolysacharrides (LPS)[162] using Smart-seq revealed hundreds of genes expressed in high variability and unique bimodal profiles that were similarly observed during early mammalian embryogenesis[13,156]. Among them, 137 genes are anti-virus genes. The spleen is the largest lymphatic organ in the human body. The heterogeneity of 1,536 splenic cells was explored using massively parallel MART-seq with low-depth RNA sampling[61]. From them, the method coupled with a probabilistic mixture model demonstrated sensitive cell classification for distinct identification of B cells, natural killer cells, macrophages, monocytes, and plasmacytoid DCs. In DCs, four subpopulations were found either significantly linked or supported by internal combinatorial marker gene expressions. After exposure to LPS, 1,536 spleen cells’ scRNA-seq displayed the heterogeneity in DCs with enriched CD11c expression and their response to LPS. In the adaptive immune system, differentiation of naïve T cells into T helper 2 (Th2) cells is a feedback loop to restrain immune overreaction[163]. From 91 single Th2 cells acquired post infection of naïve T cells, scRNA-seq revealed unique subpopulations with transcriptional profiles and changes in transcription factors, cytokines, surface receptors, and other pathways[115,164].
Mining efforts on heterogeneity of other tissues are ongoing in muscle, lung, intestine, testis, pancreas, and the nervous system. The sci-RNA-seq was applied to profile nearly 50,000 cells from nematodes (Caenorhabditis elegans) with more than 50-fold somatic cellular coverage at the L2 larval stage[67]. From the data, consensus expression profiles for 27 cell types were defined and rare neuronal cell types with one or two cells were sensitively recovered. The global view of regulatory networks for human skeletal muscle myoblast differentiation has been masked by the low resolution of bulk genomic data[149]. ScRNA-seq coupled with a nonlinear MONOCLE pseudotime trajectory prediction model discovered dynamic expression in 1,061 genes that clustered in gene regulatory groups responsible for activation and suppression at three time points after differentiation initiation. During Embryonic Days 16.5-18.5, murine lung cell lineages at respiratory airway tips are developed from columnar epithelial progenitor cells into flat alveolar type 1 (AT1) or cuboidal type 2 (AT2) cells for gas exchange or surfactant secretion, respectively[165]. A few markers have been identified for four cell types but the global transcriptomic dynamics during the transition is unknown[166]. Microfluidic scRNA-seq of 196 cells have delineated transcriptional signatures for an intermediate bipotential progenitor cells that precede AT1 and AT2 cells, in addition to Clara and ciliated cells[167]. CEL-seq of 238 randomly selected cells from intestinal organoids composed of major intestinal cell lineages brought a better understanding of diversity in intestinal differentiation[168]. Hierarchical clustering of gene expression correlation and rare cell identification method identified the major intestinal cell lineages and 10 clusters as novel diverse subtypes of cells. Spermatogenesis in testes is a complicated and highly orchestrated process including the differentiation of diploid spermatogonia into haploid sperm[169]. The whole picture of spermatogenesis is still far from complete. Two research groups have run scRNA-seq on thousands of dissociated cells from testis samples using Drop-seq and STAR[170,171]. A conserved continuous temporal trajectory of transcriptional dynamics was consistent in both murine and monkey reproductive models. Novel subpopulations were identified in several time points of differentiation and displayed unique transcriptional regulators and signatures. Based on CEL-seq2 data of pancreatic islet cells from four deceased patients, cell clusters by t-distributed Stochastic Neighbor Embedding (t-SNE) analysis showed the classical pancreatic cell types with marker genes and additional novel markers that have not been reported previously[172].
The central nervous system is composed of large amounts of neuronal and glial cells with numerous types, and the classical methods to identify them with some molecular markers were limited and not definitive[173]. Single-cell transcripts of ~3000 cells from mouse somatosensory S1 cortex and hippocampus Cornu Ammonis (CA) were analyzed by STRT/C1[174]. Cell type classification identified nine major classes and 47 molecularly distinct subclasses. scRNA-seq of 30,000 nuclei from mouse and human archived brain tissues from hippocampus and prefrontal cortex was carried out by DroNc-seq[66]. With fewer genes detected, cell clustering analysis still identified novel cell types along with well-known cell types.
In other independent studies, there were more than 100 subclasses of cells found in mouse brain and spinal cord[68,175]. Ribosomes And Intact Single Nucleus (RAISIN) RNA-seq and MIning RAre Cells sequencingMIRACL-seq processed transcriptomes of thousands of neurons in mouse and human enteric nervous system for species-specific transcription signatures and dozens of neuronal subtypes[176]. From 44,808 mouse retinal cells, 39 transcriptionally distinct cell populations were identified, creating an atlas of gene expression for the classification of retinal cells and novel rare subtypes[33].
Heterogeneity in cancers
The transcriptomic heterogeneity of tumors evolves temporospatially during tumor progression with genetic, epigenetic, and tumor immune microenvironmental fluctuations[5,7,177]. ScRNA-seq is a powerful tool to address the tumoral heterogeneity, particularly for rare cells and previously unrecognizable subpopulations[128]. Smart-seq was applied to stratify heterogenous cell subpopulations in 672 cells from five glioblastoma tumors[14]. Despite apparent cell-to-cell variability, unbiased cell hierarchical clustering showed four meta-signatures comprised of cell-cycle, hypoxia, complement/immune response, and oligodendritic function. Gene expression profiling of 4,347 cells from six Isocitrate dehydrogenase 1(IDH1) or IDH2 mutant human oligodendrogliomas displayed distinct expression signatures[178]. With bulk exome sequencing and copy number variation estimation, a hierarchical cell lineage map with variant stem/progenitor cell components was delineated in each tumor. Noncanonical WNT activation signaling was noted in retrospective analysis of 77 circulating tumor cells from 13 prostate cancer (PCa) patients following tumor progression compared with stable counterparts undergoing androgen deprivation therapy[179]. This study indicated a potential novel therapeutic target and predictive biomarker for PCa.
From multicellular ecosystem of metastatic melanoma, 4,645 single cells isolated from 19 patients were subject to analysis for profiling malignant, immune, stromal, and endothelial cells[180]. The principle component analysis of scRNA-seq data showed that the transcriptomic expression could discern malignant cells from tumor and nonmalignant cells (immune cells, stromal cells, endothelial cells, and fibroblasts) independent of biopsy sites. The transcriptional signatures for malignant cells consist of a core set of cell-cycle genes and a set of immediate early-activation transcription factors that displayed spatial difference. Meanwhile, a drug-resistant subpopulation with high AXL or MITF signals was present in treatment-naive tumors. Treatment-naïve tumors are usually sensitive to initial therapy and generally respond to first-line therapy. However, most advanced tumors acquire drug resistance and lead to poor survival outcomes. Androgen deprivation therapy[8] is effective for the majority of PCa but biochemical recurrence occurs in 30% of patients subject to treatment, and there is a limited understanding of the underlying mechanisms. From 144 cells treated or untreated with androgen, subpopulations of heterogeneous LNCaP cells were revealed and exhibited high levels of ten cell-cycle-related genes using Smart-seq2 analysis[130]. The subpopulations of cells showed cancer stemness phenotype and became resistant to cell-cycle targeting agents. ScRNA-seq and imaging found transcriptional variation and a pre-adapted subpopulation that exhibited resistance to endocrine therapy[181]. ScRNA-seq identified a stem-like subpopulation of PCa cells from monolayer and organoid culture[182].
Smart-seq2 was deployed to sequence single cells derived from treatment naïve, residual disease, and progressive disease following tyrosine kinase inhibitor (TKI)-based therapies in tumor derived from non-small cell lung cancer patients for mapping transcriptional alterations unique to drug-sensitive and drug-resistant tumor cell populations[183]. The scRNA-seq data of 23,261 cells from 49 samples show high-power resolution of high cellular heterogeneity and that residual disease tumors have fewer proliferative markers and increased alveolar cell markers. In TKI-resistant tumors, the upregulated genes were related to oncogenesis and inflammation. Moreover, progressive disease had increased infiltration of immune cells, predominant MF2 macrophages, and suppressive T cells in tumor microenvironments.
Melanoma-associated immune and stromal cells were isolated and analyzed by Smart-seq2 at three time points during tumor development[184]. The three temporal subpopulations of stromal cells displayed unique functional signatures. The lymphocytes from lymph nodes underwent activation and clonal expansion in tumors. To map the heterogeneity in the immune cells within hepatocellular carcinoma tumors, scRNA-seq methods were used to study CD45+ cells isolated from tumors and four immune-relevant sites of 16 treatment-naïve liver cancer patients[129]. it was found that LAMP3+ dendric cells contain unique transcriptional features affecting other immune cell types and show the ability to migrate to lymph nodes. Exhibiting distinct transcriptional states, tumor-associated macrophages were associated with poor prognosis[185]. The inflammatory roles of SLC40A1 and GPNMB were clearly demonstrated in these cells.
Conclusion
Cell heterogeneity has been more appreciated under the light of a new paradigm due to the advances of scRNA-seq and other single-cell analysis technologies. Since its induction, scRNA-seq has been well received and undergone fast-paced technical advances in uniform cDNA amplification, length coverage, rare copy detection, multiplexing, high throughput, processing of metadata, DEG calling, cell clustering, subpopulation identification, and cell fate trajectory predictions. Along with the new technology progress with higher sensitivity and accuracy, our understanding about the extent of cellular heterogeneity has been swiftly updated and repeatedly brought to another level. The discovery of new cell subpopulations and rare cell types with transcriptomic signatures posit new mechanisms for cell functions and defects that lead to novel biomedical applications and rising therapeutic venues.
Declarations
Authors’ contributionsLiterature search and manuscript draft: Lieberman B, Kusi M, Hung CN, Chou CW, Chen CL
Tables: Lieberman B, Kusi M, Hung CN, Chen CL
Graphs: He N, Chen CL
Review and revision: Ho YY, Taverna JA, Huang THM, Chen CL
Availability of data and materialsNot appliable.
Financial support and sponsorshipThis work was supported by NIH grants U54CA217297 (Huang THM and Chen CL), Cancer Prevention & Research Institute of Texas (CPRIT) grants (RP150600) (Huang THM and Chen CL). Lieberman B and Kusi M were supported by U54 Summer Undergraduate Scholar grant and the CPRIT predoctoral training grant (RP170345), respectively.
Conflicts of interestAll authors declared that there are no conflicts of interest.
Ethical approval and consent to participateNot applicable.
Consent for publicationNot applicable.
Copyright© The Author(s) 2021.
REFERENCES
1. Golding I, Paulsson J, Zawilski SM, Cox EC. Real-time kinetics of gene activity in individual bacteria. Cell 2005;123:1025-36.
2. Cai L, Friedman N, Xie XS. Stochastic protein expression in individual cells at the single molecule level. Nature 2006;440:358-62.
3. Wang D, Bodovitz S. Single cell analysis: the new frontier in “omics”. Trends Biotechnol 2010;28:281-90.
4. Kalisky T, Blainey P, Quake SR. Genomic analysis at the single-cell level. Annu Rev Genet 2011;45:431-45.
5. Swanton C. Intratumor heterogeneity: evolution through space and time. Cancer Res 2012;72:4875-82.
6. Altschuler SJ, Wu LF. Cellular heterogeneity: do differences make a difference? Cell 2010;141:559-63.
7. Meacham CE, Morrison SJ. Tumour heterogeneity and cancer cell plasticity. Nature 2013;501:328-37.
8. Graf T, Stadtfeld M. Heterogeneity of embryonic and adult stem cells. Cell Stem Cell 2008;3:480-3.
9. Bengtsson M, Ståhlberg A, Rorsman P, Kubista M. Gene expression profiling in single cells from the pancreatic islets of Langerhans reveals lognormal distribution of mRNA levels. Genome Res 2005;15:1388-92.
10. Raj A, Peskin CS, Tranchina D, Vargas DY, Tyagi S. Stochastic mRNA synthesis in mammalian cells. PLoS Biol 2006;4:e309.
11. Waks Z, Silver PA. Nuclear origins of cell-to-cell variability. Cold Spring Harb Symp Quant Biol 2010;75:87-94.
12. Buenrostro JD, Wu B, Litzenburger UM, et al. Single-cell chromatin accessibility reveals principles of regulatory variation. Nature 2015;523:486-90.
13. Shalek AK, Satija R, Adiconis X, et al. Single-cell transcriptomics reveals bimodality in expression and splicing in immune cells. Nature 2013;498:236-40.
14. Patel AP, Tirosh I, Trombetta JJ, et al. Single-cell RNA-seq highlights intratumoral heterogeneity in primary glioblastoma. Science 2014;344:1396-401.
15. Gawad C, Koh W, Quake SR. Single-cell genome sequencing: current state of the science. Nat Rev Genet 2016;17:175-88.
16. Irish JM, Kotecha N, Nolan GP. Mapping normal and cancer cell signalling networks: towards single-cell proteomics. Nat Rev Cancer 2006;6:146-55.
17. Tang F, Barbacioru C, Bao S, et al. Tracing the derivation of embryonic stem cells from the inner cell mass by single-cell RNA-Seq analysis. Cell Stem Cell 2010;6:468-78.
18. Islam S, Kjällquist U, Moliner A, et al. Characterization of the single-cell transcriptional landscape by highly multiplex RNA-seq. Genome Res 2011;21:1160-7.
19. Saliba AE, Westermann AJ, Gorski SA, Vogel J. Single-cell RNA-seq: advances and future challenges. Nucleic Acids Res 2014;42:8845-60.
20. Choi PJ, Xie XS, Shakhnovich EI. Stochastic switching in gene networks can occur by a single-molecule event or many molecular steps. J Mol Biol 2010;396:230-44.
21. Gupta PB, Fillmore CM, Jiang G, et al. Stochastic state transitions give rise to phenotypic equilibrium in populations of cancer cells. Cell 2011;146:633-44.
22. Nagano T, Lubling Y, Stevens TJ, et al. Single-cell Hi-C reveals cell-to-cell variability in chromosome structure. Nature 2013;502:59-64.
23. Bahar R, Hartmann CH, Rodriguez KA, et al. Increased cell-to-cell variation in gene expression in ageing mouse heart. Nature 2006;441:1011-4.
24. Kolodziejczyk AA, Kim JK, Svensson V, Marioni JC, Teichmann SA. The technology and biology of single-cell RNA sequencing. Mol Cell 2015;58:610-20.
25. Haque A, Engel J, Teichmann SA, Lönnberg T. A practical guide to single-cell RNA-sequencing for biomedical research and clinical applications. Genome Med 2017;9:75.
26. Chen CL, Mahalingam D, Osmulski P, et al. Single-cell analysis of circulating tumor cells identifies cumulative expression patterns of EMT-related genes in metastatic prostate cancer. Prostate 2013;73:813-26.
27. Hu P, Zhang W, Xin H, Deng G. Single cell isolation and analysis. Front Cell Dev Biol 2016;4:116.
28. Hwang B, Lee JH, Bang D. Single-cell RNA sequencing technologies and bioinformatics pipelines. Exp Mol Med 2018;50:96.
29. Setty M, Tadmor MD, Reich-Zeliger S, et al. Wishbone identifies bifurcating developmental trajectories from single-cell data. Nat Biotechnol 2016;34:637-45.
30. Bendall SC, Nolan GP, Roederer M, Chattopadhyay PK. A deep profiler’s guide to cytometry. Trends Immunol 2012;33:323-32.
31. Reece A, Xia B, Jiang Z, Noren B, McBride R, Oakey J. Microfluidic techniques for high throughput single cell analysis. Curr Opin Biotechnol 2016;40:90-6.
32. Bai Y, Gao M, Wen L, et al. Applications of microfluidics in quantitative biology. Biotechnol J 2018;13:e1700170.
33. Macosko EZ, Basu A, Satija R, et al. Highly parallel genome-wide expression profiling of individual cells using nanoliter droplets. Cell 2015;161:1202-14.
34. Klein AM, Mazutis L, Akartuna I, et al. Droplet barcoding for single-cell transcriptomics applied to embryonic stem cells. Cell 2015;161:1187-201.
35. Chen H, Sun J, Wolvetang E, Cooper-White J. High-throughput, deterministic single cell trapping and long-term clonal cell culture in microfluidic devices. Lab Chip 2015;15:1072-83.
36. Espina V, Milia J, Wu G, Cowherd S, Liotta LA. Laser capture microdissection. In: Taatjes DJ, Mossman BT, editors. Cell imaging techniques. Totowa: Humana Press; 2006. pp. 213-29.
37. Espina V, Wulfkuhle JD, Calvert VS, et al. Laser-capture microdissection. Nat Protoc 2006;1:586-603.
38. Civita P, Franceschi S, Aretini P, et al. Laser capture microdissection and RNA-Seq analysis: high sensitivity approaches to explain histopathological heterogeneity in human glioblastoma FFPE archived tissues. Front Oncol 2019;9:482.
39. Datta S, Malhotra L, Dickerson R, Chaffee S, Sen CK, Roy S. Laser capture microdissection: Big data from small samples. Histol Histopathol 2015;30:1255-69.
40. Cornelison DD, Wold BJ. Single-cell analysis of regulatory gene expression in quiescent and activated mouse skeletal muscle satellite cells. Dev Biol 1997;191:270-83.
41. Kamme F, Salunga R, Yu J, et al. Single-cell microarray analysis in hippocampus CA1: demonstration and validation of cellular heterogeneity. J Neurosci 2003;23:3607-15.
42. Tang F, Barbacioru C, Nordman E, et al. RNA-Seq analysis to capture the transcriptome landscape of a single cell. Nat Protoc 2010;5:516-35.
43. Tang F, Barbacioru C, Wang Y, et al. mRNA-Seq whole-transcriptome analysis of a single cell. Nat Methods 2009;6:377-82.
44. Luecken MD, Theis FJ. Current best practices in single-cell RNA-seq analysis: a tutorial. Mol Syst Biol 2019;15:e8746.
45. Kurimoto K, Yabuta Y, Ohinata Y, Saitou M. Global single-cell cDNA amplification to provide a template for representative high-density oligonucleotide microarray analysis. Nat Protoc 2007;2:739-52.
46. Kurimoto K, Yabuta Y, Ohinata Y, et al. An improved single-cell cDNA amplification method for efficient high-density oligonucleotide microarray analysis. Nucleic Acids Res 2006;34:e42.
47. Zhu YY, Machleder EM, Chenchik A, Li R, Siebert PD. Reverse transcriptase template switching: a SMART approach for full-length cDNA library construction. Biotechniques 2001;30:892-7.
48. Islam S, Zeisel A, Joost S, et al. Quantitative single-cell RNA-seq with unique molecular identifiers. Nat Methods 2014;11:163-6.
49. Ramsköld D, Luo S, Wang YC, et al. Full-length mRNA-Seq from single-cell levels of RNA and individual circulating tumor cells. Nat Biotechnol 2012;30:777-82.
50. Picelli S, Faridani OR, Björklund AK, Winberg G, Sagasser S, Sandberg R. Full-length RNA-seq from single cells using Smart-seq2. Nat Protoc 2014;9:171-81.
51. Picelli S, Björklund ÅK, Faridani OR, Sagasser S, Winberg G, Sandberg R. Smart-seq2 for sensitive full-length transcriptome profiling in single cells. Nat Methods 2013;10:1096-8.
52. Fu GK, Hu J, Wang PH, Fodor SP. Counting individual DNA molecules by the stochastic attachment of diverse labels. Proc Natl Acad Sci U S A 2011;108:9026-31.
53. Kivioja T, Vähärautio A, Karlsson K, et al. Counting absolute numbers of molecules using unique molecular identifiers. Nat Methods 2011;9:72-4.
54. Hashimshony T, Wagner F, Sher N, Yanai I. CEL-Seq: single-cell RNA-Seq by multiplexed linear amplification. Cell Rep 2012;2:666-73.
55. Hashimshony T, Senderovich N, Avital G, et al. CEL-Seq2: sensitive highly-multiplexed single-cell RNA-Seq. Genome Biol 2016;17:77.
56. Soumillon M, Cacchiarelli D, Semrau S, van Oudenaarden A, Mikkelsen TS. Characterization of directed differentiation by high-throughput single-cell RNA-Seq. BioRxiv 2014;003236.
57. Sheng K, Cao W, Niu Y, Deng Q, Zong C. Effective detection of variation in single-cell transcriptomes using MATQ-seq. Nat Methods 2017;14:267-70.
58. Hayashi T, Ozaki H, Sasagawa Y, Umeda M, Danno H, Nikaido I. Single-cell full-length total RNA sequencing uncovers dynamics of recursive splicing and enhancer RNAs. Nat Commun 2018;9:619.
59. Ozsolak F, Goren A, Gymrek M, et al. Digital transcriptome profiling from attomole-level RNA samples. Genome Res 2010;20:519-25.
60. Sasagawa Y, Nikaido I, Hayashi T, et al. Quartz-Seq: a highly reproducible and sensitive single-cell RNA sequencing method, reveals non-genetic gene-expression heterogeneity. Genome Biol 2013;14:R31.
61. Jaitin DA, Kenigsberg E, Keren-Shaul H, et al. Massively parallel single-cell RNA-seq for marker-free decomposition of tissues into cell types. Science 2014;343:776-9.
62. Wölfel R, Corman VM, Guggemos W, et al. Virological assessment of hospitalized patients with COVID-2019. Nature 2020;581:465-9.
63. Zheng GX, Terry JM, Belgrader P, et al. Massively parallel digital transcriptional profiling of single cells. Nat Commun 2017;8:14049.
64. Gierahn TM, Wadsworth MH 2nd, Hughes TK, et al. Seq-well: portable, low-cost RNA sequencing of single cells at high throughput. Nat Methods 2017;14:395-8.
65. Fan HC, Fu GK, Fodor SP. Expression profiling. Combinatorial labeling of single cells for gene expression cytometry. Science 2015;347:1258367.
66. Habib N, Avraham-Davidi I, Basu A, et al. Massively parallel single-nucleus RNA-seq with DroNc-seq. Nat Methods 2017;14:955-8.
67. Cao J, Packer JS, Ramani V, et al. Comprehensive single-cell transcriptional profiling of a multicellular organism. Science 2017;357:661-7.
68. Rosenberg AB, Roco CM, Muscat RA, et al. Single-cell profiling of the developing mouse brain and spinal cord with split-pool barcoding. Science 2018;360:176-82.
69. Bhargava V, Ko P, Willems E, Mercola M, Subramaniam S. Quantitative transcriptomics using designed primer-based amplification. Sci Rep 2013;3:1740.
70. Nakamura T, Yabuta Y, Okamoto I, et al. SC3-seq: a method for highly parallel and quantitative measurement of single-cell gene expression. Nucleic Acids Res 2015;43:e60.
71. Ziegenhain C, Vieth B, Parekh S, et al. Comparative analysis of single-cell RNA sequencing methods. Mol Cell 2017;65:631-43.e4.
72. Svensson V, Natarajan KN, Ly LH, et al. Power analysis of single-cell RNA-sequencing experiments. Nat Methods 2017;14:381-7.
73. Zhang X, Li T, Liu F, et al. Comparative analysis of droplet-based ultra-high-throughput single-cell RNA-seq systems. Mol Cell 2019;73:130-42.e5.
74. Mereu E, Lafzi A, Moutinho C, et al. Benchmarking single-cell RNA-sequencing protocols for cell atlas projects. Nat Biotechnol 2020;38:747-55.
75. Poirion OB, Zhu X, Ching T, Garmire L. Single-cell transcriptomics bioinformatics and computational challenges. Front Genet 2016;7:163.
76. Finotello F, Rieder D, Hackl H, Trajanoski Z. Next-generation computational tools for interrogating cancer immunity. Nat Rev Genet 2019;20:724-46.
77. Butler A, Hoffman P, Smibert P, Papalexi E, Satija R. Integrating single-cell transcriptomic data across different conditions, technologies, and species. Nat Biotechnol 2018;36:411-20.
78. Satija R, Farrell JA, Gennert D, Schier AF, Regev A. Spatial reconstruction of single-cell gene expression data. Nat Biotechnol 2015;33:495-502.
79. Wolf FA, Angerer P, Theis FJ. SCANPY: large-scale single-cell gene expression data analysis. Genome Biol 2018;19:15.
80. Yang X, Liu D, Liu F, et al. HTQC: a fast quality control toolkit for Illumina sequencing data. BMC Bioinformatics 2013;14:33.
81. Wood DE, Salzberg SL. Kraken: ultrafast metagenomic sequence classification using exact alignments. Genome Biol 2014;15:R46.
82. Jiang P, Thomson JA, Stewart R. Quality control of single-cell RNA-seq by SinQC. Bioinformatics 2016;32:2514-6.
83. Diaz A, Liu SJ, Sandoval C, et al. SCell: integrated analysis of single-cell RNA-seq data. Bioinformatics 2016;32:2219-20.
84. Ilicic T, Kim JK, Kolodziejczyk AA, et al. Classification of low quality cells from single-cell RNA-seq data. Genome Biol 2016;17:29.
85. Trapnell C, Pachter L, Salzberg SL. TopHat: discovering splice junctions with RNA-Seq. Bioinformatics 2009;25:1105-11.
86. Dobin A, Davis CA, Schlesinger F, et al. STAR: ultrafast universal RNA-seq aligner. Bioinformatics 2013;29:15-21.
87. Kim D, Langmead B, Salzberg SL. HISAT: a fast spliced aligner with low memory requirements. Nat Methods 2015;12:357-60.
88. Bray NL, Pimentel H, Melsted P, Pachter L. Near-optimal probabilistic RNA-seq quantification. Nat Biotechnol 2016;34:525-7.
89. Patro R, Duggal G, Love MI, Irizarry RA, Kingsford C. Salmon provides fast and bias-aware quantification of transcript expression. Nat Methods 2017;14:417-9.
90. Srivastava A, Malik L, Sarkar H, et al. Alignment and mapping methodology influence transcript abundance estimation. Genome Biol 2020;21:239.
91. Lytal N, Ran D, An L. Normalization methods on single-cell RNA-seq data: an empirical survey. Front Genet 2020;11:41.
92. Hafemeister C, Satija R. Normalization and variance stabilization of single-cell RNA-seq data using regularized negative binomial regression. Genome Biol 2019;20:296.
93. Katayama S, Töhönen V, Linnarsson S, Kere J. SAMstrt: statistical test for differential expression in single-cell transcriptome with spike-in normalization. Bioinformatics 2013;29:2943-5.
94. Vallejos CA, Marioni JC, Richardson S. BASiCS: bayesian analysis of single-cell sequencing data. PLoS Comput Biol 2015;11:e1004333.
95. Ding B, Zheng L, Zhu Y, et al. Normalization and noise reduction for single cell RNA-seq experiments. Bioinformatics 2015;31:2225-7.
96. Lun AT, Bach K, Marioni JC. Pooling across cells to normalize single-cell RNA sequencing data with many zero counts. Genome Biol 2016;17:75.
97. Bacher R, Chu LF, Leng N, et al. SCnorm: robust normalization of single-cell RNA-seq data. Nat Methods 2017;14:584-6.
98. Yip SH, Wang P, Kocher JA, Sham PC, Wang J. Corrigendum: Linnorm: improved statistical analysis for single cell RNA-seq expression data. Nucleic Acids Res 2017;45:13097.
99. Robinson MD, Oshlack A. A scaling normalization method for differential expression analysis of RNA-seq data. Genome Biol 2010;11:R25.
100. Robinson MD, McCarthy DJ, Smyth GK. edgeR: a bioconductor package for differential expression analysis of digital gene expression data. Bioinformatics 2010;26:139-40.
101. Love MI, Huber W, Anders S. Moderated estimation of fold change and dispersion for RNA-seq data with DESeq2. Genome Biol 2014;15:550.
102. Tian L, Dong X, Freytag S, et al. Benchmarking single cell RNA-sequencing analysis pipelines using mixture control experiments. Nat Methods 2019;16:479-87.
103. Kadota K, Shimizu K. Commentary: a systematic evaluation of single cell RNA-Seq analysis pipelines. Front Genet 2020;11:941.
104. Kadota K, Nishiyama T, Shimizu K. A normalization strategy for comparing tag count data. Algorithms Mol Biol 2012;7:5.
105. Wagner F, Yan Y, Yanai I. K-nearest neighbor smoothing for high-throughput single-cell RNA-Seq data. bioRxiv 2018;217737.
106. Gong W, Kwak IY, Pota P, Koyano-Nakagawa N, Garry DJ. DrImpute: imputing dropout events in single cell RNA sequencing data. BMC Bioinformatics 2018;19:220.
107. Huang M, Wang J, Torre E, et al. SAVER: gene expression recovery for single-cell RNA sequencing. Nat Methods 2018;15:539-42.
110. Tran HTN, Ang KS, Chevrier M, et al. A benchmark of batch-effect correction methods for single-cell RNA sequencing data. Genome Biol 2020;21:12.
111. Haghverdi L, Lun ATL, Morgan MD, Marioni JC. Batch effects in single-cell RNA-sequencing data are corrected by matching mutual nearest neighbors. Nat Biotechnol 2018;36:421-7.
112. Stuart T, Butler A, Hoffman P, et al. Comprehensive integration of single-cell data. Cell 2019;177:1888-902.e21.
113. Korsunsky I, Millard N, Fan J, et al. Fast, sensitive and accurate integration of single-cell data with Harmony. Nat Methods 2019;16:1289-96.
114. Lin Y, Ghazanfar S, Wang KYX, et al. scMerge leverages factor analysis, stable expression, and pseudoreplication to merge multiple single-cell RNA-seq datasets. Proc Natl Acad Sci U S A 2019;116:9775-84.
115. Buettner F, Natarajan KN, Casale FP, et al. Computational analysis of cell-to-cell heterogeneity in single-cell RNA-sequencing data reveals hidden subpopulations of cells. Nat Biotechnol 2015;33:155-60.
116. Barron M, Li J. Identifying and removing the cell-cycle effect from single-cell RNA-Sequencing data. Sci Rep 2016;6:33892.
117. Wang T, Li B, Nelson CE, Nabavi S. Comparative analysis of differential gene expression analysis tools for single-cell RNA sequencing data. BMC Bioinformatics 2019;20:40.
118. Van Der Maaten L. Accelerating t-SNE using tree-based algorithms. J Mach Learn Res 2015;15:3221-45.
119. Van Der Maaten L, Hinton G. Visualizing data using t-SNE. J Mach Learn Res 2008;9:2579-625.
120. Becht E, McInnes L, Healy J, et al. Dimensionality reduction for visualizing single-cell data using UMAP. Nat Biotechnol 2018:38-44.
121. Chen G, Ning B, Shi T. Single-cell RNA-Seq technologies and related computational data analysis. Front Genet 2019;10:317.
122. Kiselev VY, Andrews TS, Hemberg M. Challenges in unsupervised clustering of single-cell RNA-seq data. Nat Rev Genet 2019;20:273-82.
123. Cao J, Spielmann M, Qiu X, et al. The single-cell transcriptional landscape of mammalian organogenesis. Nature 2019;566:496-502.
124. Mu Q, Chen Y, Wang J. Deciphering brain complexity using single-cell sequencing. Genomics Proteomics Bioinformatics 2019;17:344-66.
125. Ofengeim D, Giagtzoglou N, Huh D, Zou C, Yuan J. Single-cell RNA sequencing: unraveling the brain one cell at a time. Trends Mol Med 2017;23:563-76.
126. Potter SS. Single-cell RNA sequencing for the study of development, physiology and disease. Nat Rev Nephrol 2018;14:479-92.
127. Ranzoni AM, Cvejic A. Single-cell biology: resolving biological complexity, one cell at a time. Development 2018;145:dev163972.
128. Levitin HM, Yuan J, Sims PA. Single-cell transcriptomic analysis of tumor heterogeneity. Trends Cancer 2018;4:264-8.
129. Zhang Q, He Y, Luo N, et al. Landscape and dynamics of single immune cells in hepatocellular carcinoma. Cell 2019;179:829-45.e20.
130. Horning AM, Wang Y, Lin CK, et al. Single-cell RNA-seq reveals a subpopulation of prostate cancer cells with enhanced cell-cycle-related transcription and attenuated androgen response. Cancer Res 2018;78:853-64.
131. Wang W, Niu X, Stuart T, et al. A single-cell transcriptional roadmap for cardiopharyngeal fate diversification. Nat Cell Biol 2019;21:674-86.
132. Kharchenko PV, Silberstein L, Scadden DT. Bayesian approach to single-cell differential expression analysis. Nat Methods 2014;11:740-2.
133. Fan J, Salathia N, Liu R, et al. Characterizing transcriptional heterogeneity through pathway and gene set overdispersion analysis. Nat Methods 2016;13:241-4.
134. Wang T, Nabavi S. SigEMD: a powerful method for differential gene expression analysis in single-cell RNA sequencing data. Methods 2018;145:25-32.
135. Guo M, Wang H, Potter SS, Whitsett JA, Xu Y. SINCERA: a pipeline for single-cell RNA-Seq profiling analysis. PLoS Comput Biol 2015;11:e1004575.
136. Pierson E, Yau C. ZIFA: Dimensionality reduction for zero-inflated single-cell gene expression analysis. Genome Biol 2015;16:241.
137. Wang B, Zhu J, Pierson E, Ramazzotti D, Batzoglou S. Visualization and analysis of single-cell RNA-seq data by kernel-based similarity learning. Nat Methods 2017;14:414-6.
138. Bose S, Wan Z, Carr A, et al. Scalable microfluidics for single-cell RNA printing and sequencing. Genome Biol 2015;16.
139. Hou R, Denisenko E, Forrest ARR. scMatch: a single-cell gene expression profile annotation tool using reference datasets. Bioinformatics 2019;35:4688-95.
140. Aran D, Looney AP, Liu L, et al. Reference-based analysis of lung single-cell sequencing reveals a transitional profibrotic macrophage. Nat Immunol 2019;20:163-72.
141. Cao ZJ, Wei L, Lu S, Yang DC, Gao G. Searching large-scale scRNA-seq databases via unbiased cell embedding with Cell BLAST. Nat Commun 2020;11:3458.
142. Tritschler S, Büttner M, Fischer DS, et al. Concepts and limitations for learning developmental trajectories from single cell genomics. Development 2019;146:dev170506.
143. Pang B, Xu J, Hu J, et al. Single-cell RNA-seq reveals the invasive trajectory and molecular cascades underlying glioblastoma progression. Mol Oncol 2019;13:2588-603.
144. Haghverdi L, Büttner M, Wolf FA, Buettner F, Theis FJ. Diffusion pseudotime robustly reconstructs lineage branching. Nat Methods 2016;13:845-8.
145. Chen H, Albergante L, Hsu JY, et al. Single-cell trajectories reconstruction, exploration and mapping of omics data with STREAM. Nat Commun 2019;10:1903.
146. Chestnut B, Casie Chetty S, Koenig AL, Sumanas S. Single-cell transcriptomic analysis identifies the conversion of zebrafish Etv2-deficient vascular progenitors into skeletal muscle. Nat Commun 2020;11:2796.
147. Ji Z, Ji H. TSCAN: pseudo-time reconstruction and evaluation in single-cell RNA-seq analysis. Nucleic Acids Res 2016;44:e117.
148. Street K, Risso D, Fletcher RB, et al. Slingshot: cell lineage and pseudotime inference for single-cell transcriptomics. BMC Genomics 2018;19:477.
149. Trapnell C, Cacchiarelli D, Grimsby J, et al. The dynamics and regulators of cell fate decisions are revealed by pseudotemporal ordering of single cells. Nat Biotechnol 2014;32:381-6.
150. Shin J, Berg DA, Zhu Y, et al. Single-cell RNA-Seq with waterfall reveals molecular cascades underlying adult neurogenesis. Cell Stem Cell 2015;17:360-72.
151. Marco E, Karp RL, Guo G, et al. Bifurcation analysis of single-cell gene expression data reveals epigenetic landscape. Proc Natl Acad Sci U S A 2014;111:E5643-50.
152. Singer M, Anderson AC. Revolutionizing cancer immunology: the power of next-generation sequencing technologies. Cancer Immunol Res 2019;7:168-73.
153. Giladi A, Amit I. Single-cell genomics: a stepping stone for future immunology discoveries. Cell 2018;172:14-21.
154. Cloonan N, Forrest AR, Kolle G, et al. Stem cell transcriptome profiling via massive-scale mRNA sequencing. Nat Methods 2008;5:613-9.
155. Yan L, Yang M, Guo H, et al. Single-cell RNA-Seq profiling of human preimplantation embryos and embryonic stem cells. Nat Struct Mol Biol 2013;20:1131-9.
156. Biase FH, Cao X, Zhong S. Cell fate inclination within 2-cell and 4-cell mouse embryos revealed by single-cell RNA sequencing. Genome Res 2014;24:1787-96.
157. Deng Q, Ramsköld D, Reinius B, Sandberg R. Single-cell RNA-seq reveals dynamic, random monoallelic gene expression in mammalian cells. Science 2014;343:193-6.
158. Petropoulos S, Edsgärd D, Reinius B, et al. Single-cell RNA-Seq reveals lineage and X chromosome dynamics in human preimplantation embryos. Cell 2016;167:285.
159. Papalexi E, Satija R. Single-cell RNA sequencing to explore immune cell heterogeneity. Nat Rev Immunol 2018;18:35-45.
160. Bar-On L, Birnberg T, Lewis KL, et al. CX3CR1+ CD8alpha+ dendritic cells are a steady-state population related to plasmacytoid dendritic cells. Proc Natl Acad Sci U S A 2010;107:14745-50.
161. Hume DA. Applications of myeloid-specific promoters in transgenic mice support in vivo imaging and functional genomics but do not support the concept of distinct macrophage and dendritic cell lineages or roles in immunity. J Leukoc Biol 2011;89:525-38.
162. Rosenberg R, Gertler R, Friederichs J, et al. Comparison of two density gradient centrifugation systems for the enrichment of disseminated tumor cells in blood. Cytometry 2002;49:150-8.
163. Zhu J, Yamane H, Paul WE. Differentiation of effector CD4 T cell populations (*). Annu Rev Immunol 2010;28:445-89.
164. Mahata B, Zhang X, Kolodziejczyk AA, et al. Single-cell RNA sequencing reveals T helper cells synthesizing steroids de novo to contribute to immune homeostasis. Cell Rep 2014;7:1130-42.
165. Desai TJ, Brownfield DG, Krasnow MA. Alveolar progenitor and stem cells in lung development, renewal and cancer. Nature 2014;507:190-4.
166. Kim CF, Jackson EL, Woolfenden AE, et al. Identification of bronchioalveolar stem cells in normal lung and lung cancer. Cell 2005;121:823-35.
167. Treutlein B, Brownfield DG, Wu AR, et al. Reconstructing lineage hierarchies of the distal lung epithelium using single-cell RNA-seq. Nature 2014;509:371-5.
168. Grün D, Lyubimova A, Kester L, et al. Single-cell messenger RNA sequencing reveals rare intestinal cell types. Nature 2015;525:251-5.
169. Hammoud SS, Low DH, Yi C, et al. Transcription and imprinting dynamics in developing postnatal male germline stem cells. Genes Dev 2015;29:2312-24.
170. Lau X, Munusamy P, Ng MJ, Sangrithi M. Single-cell RNA sequencing of the cynomolgus macaque testis reveals conserved transcriptional profiles during mammalian spermatogenesis. Dev Cell 2020;54:548-66.e7.
171. Green CD, Ma Q, Manske GL, et al. A comprehensive roadmap of murine spermatogenesis defined by single-cell RNA-Seq. Dev Cell 2018;46:651-67.e10.
172. Muraro MJ, Dharmadhikari G, Grün D, et al. A single-cell transcriptome Atlas of the human pancreas. Cell Syst 2016;3:385-394.e3.
174. Zeisel A, Muñoz-Manchado AB, Codeluppi S, et al. Brain structure. Cell types in the mouse cortex and hippocampus revealed by single-cell RNA-seq. Science 2015;347:1138-42.
175. Zeisel A, Hochgerner H, Lönnerberg P, et al. Molecular architecture of the mouse nervous system. Cell 2018;174:999-1014.e22.
176. Drokhlyansky E, Smillie CS, Van Wittenberghe N, et al. The human and mouse enteric nervous system at single-cell resolution. Cell 2020;182:1606-22.e23.
177. Almendro V, Marusyk A, Polyak K. Cellular heterogeneity and molecular evolution in cancer. Annu Rev Pathol 2013;8:277-302.
178. Tirosh I, Venteicher AS, Hebert C, et al. Single-cell RNA-seq supports a developmental hierarchy in human oligodendroglioma. Nature 2016;539:309-13.
179. Miyamoto DT, Zheng Y, Wittner BS, et al. RNA-Seq of single prostate CTCs implicates noncanonical Wnt signaling in antiandrogen resistance. Science 2015;349:1351-6.
180. Tirosh I, Izar B, Prakadan SM, et al. Dissecting the multicellular ecosystem of metastatic melanoma by single-cell RNA-seq. Science 2016;352:189-96.
181. Hong SP, Chan TE, Lombardo Y, et al. Single-cell transcriptomics reveals multi-step adaptations to endocrine therapy. Nat Commun 2019;10:3840.
182. McCray T, Moline D, Baumann B, Vander Griend DJ, Nonn L. Single-cell RNA-Seq analysis identifies a putative epithelial stem cell population in human primary prostate cells in monolayer and organoid culture conditions. Am J Clin Exp Urol 2019;7:123-38.
183. Maynard A, McCoach CE, Rotow JK, et al. Therapy-induced evolution of human lung cancer revealed by single-cell RNA sequencing. Cell 2020;182:1232-51.e22.
184. Davidson S, Efremova M, Riedel A, et al. Single-cell RNA sequencing reveals a dynamic stromal niche that supports tumor growth. Cell Rep 2020;31:107628.
185. Moon TS, Lou C, Tamsir A, Stanton BC, Voigt CA. Genetic programs constructed from layered logic gates in single cells. Nature 2012;491:249-53.
186. Fan X, Zhang X, Wu X, et al. Single-cell RNA-seq transcriptome analysis of linear and circular RNAs in mouse preimplantation embryos. Genome Biol 2015;16:148.
187. Sasagawa Y, Danno H, Takada H, et al. Quartz-Seq2: a high-throughput single-cell RNA-sequencing method that effectively uses limited sequence reads. Genome Biol 2018;19:29.
188. Ewels P, Magnusson M, Lundin S, Käller M. MultiQC: summarize analysis results for multiple tools and samples in a single report. Bioinformatics 2016;32:3047-8.
189. Kim D, Pertea G, Trapnell C, Pimentel H, Kelley R, Salzberg SL. TopHat2: accurate alignment of transcriptomes in the presence of insertions, deletions and gene fusions. Genome Biol 2013;14:R36.
190. Wu TD, Nacu S. Fast and SNP-tolerant detection of complex variants and splicing in short reads. Bioinformatics 2010;26:873-81.
191. Wang K, Singh D, Zeng Z, et al. MapSplice: accurate mapping of RNA-seq reads for splice junction discovery. Nucleic Acids Res 2010;38:e178.
192. Pertea M, Pertea GM, Antonescu CM, Chang TC, Mendell JT, Salzberg SL. StringTie enables improved reconstruction of a transcriptome from RNA-seq reads. Nat Biotechnol 2015;33:290-5.
193. Anders S, Pyl PT, Huber W. HTSeq--a Python framework to work with high-throughput sequencing data. Bioinformatics 2015;31:166-9.
194. Liao Y, Smyth GK, Shi W. featureCounts: an efficient general purpose program for assigning sequence reads to genomic features. Bioinformatics 2014;30:923-30.
195. Li B, Dewey CN. RSEM: accurate transcript quantification from RNA-Seq data with or without a reference genome. BMC Bioinformatics 2011;12:323.
196. Trapnell C, Williams BA, Pertea G, et al. Transcript assembly and quantification by RNA-Seq reveals unannotated transcripts and isoform switching during cell differentiation. Nat Biotechnol 2010;28:511-5.
197. McCarthy DJ, Campbell KR, Lun AT, Wills QF. Scater: pre-processing, quality control, normalization and visualization of single-cell RNA-seq data in R. Bioinformatics 2017;33:1179-86.
198. Zhu X, Wolfgruber TK, Tasato A, Arisdakessian C, Garmire DG, Garmire LX. Granatum: a graphical single-cell RNA-Seq analysis pipeline for genomics scientists. Genome Med 2017;9:108.
199. Gardeux V, David FPA, Shajkofci A, Schwalie PC, Deplancke B. ASAP: a web-based platform for the analysis and interactive visualization of single-cell RNA-seq data. Bioinformatics 2017;33:3123-5.
200. Lotfollahi M, Wolf FA, Theis FJ. scGen predicts single-cell perturbation responses. Nat Methods 2019;16:715-21.
201. Song Y, Botvinnik OB, Lovci MT, et al. Single-cell alternative splicing analysis with expedition reveals splicing dynamics during neuron differentiation. Mol Cell 2017;67:148-61.e5.
202. Huang Y, Sanguinetti G. BRIE: transcriptome-wide splicing quantification in single cells. Genome Biol 2017;18:123.
203. Qiu X, Hill A, Packer J, Lin D, Ma YA, Trapnell C. Single-cell mRNA quantification and differential analysis with Census. Nat Methods 2017;14:309-15.
204. Welch JD, Hu Y, Prins JF. Robust detection of alternative splicing in a population of single cells. Nucleic Acids Res 2016;44:e73.
205. Johnson WE, Li C, Rabinovic A. Adjusting batch effects in microarray expression data using empirical Bayes methods. Biostatistics 2007;8:118-27.
206. Angerer P, Haghverdi L, Büttner M, Theis FJ, Marr C, Buettner F. Destiny: diffusion maps for large-scale single-cell data in R. Bioinformatics 2016;32:1241-3.
207. Ahmed S, Rattray M, Boukouvalas A. GrandPrix: scaling up the Bayesian GPLVM for single-cell data. Bioinformatics 2019;35:47-54.
Cite This Article
Export citation file: BibTeX | RIS
OAE Style
Lieberman B, Kusi M, Hung CN, Chou CW, He N, Ho YY, Taverna JA, Huang THM, Chen CL. Toward uncharted territory of cellular heterogeneity: advances and applications of single-cell RNA-seq. J Transl Genet Genom 2021;5:1-21. http://dx.doi.org/10.20517/jtgg.2020.51
AMA Style
Lieberman B, Kusi M, Hung CN, Chou CW, He N, Ho YY, Taverna JA, Huang THM, Chen CL. Toward uncharted territory of cellular heterogeneity: advances and applications of single-cell RNA-seq. Journal of Translational Genetics and Genomics. 2021; 5(1): 1-21. http://dx.doi.org/10.20517/jtgg.2020.51
Chicago/Turabian Style
Lieberman, Brandon, Meena Kusi, Chia-Nung Hung, Chih-Wei Chou, Ning He, Yen-Yi Ho, Josephine A. Taverna, Tim H. M. Huang, Chun-Liang Chen. 2021. "Toward uncharted territory of cellular heterogeneity: advances and applications of single-cell RNA-seq" Journal of Translational Genetics and Genomics. 5, no.1: 1-21. http://dx.doi.org/10.20517/jtgg.2020.51
ACS Style
Lieberman, B.; Kusi M.; Hung C.N.; Chou C.W.; He N.; Ho Y.Y.; Taverna JA.; Huang THM.; Chen C.L. Toward uncharted territory of cellular heterogeneity: advances and applications of single-cell RNA-seq. J. Transl. Genet. Genom. 2021, 5, 1-21. http://dx.doi.org/10.20517/jtgg.2020.51
About This Article
Special Issue
Copyright

Data & Comments
Data


 Cite This Article 22 clicks

 Like This Article 12
likes
Like This Article 12
likes


Comments
Comments must be written in English. Spam, offensive content, impersonation, and private information will not be permitted. If any comment is reported and identified as inappropriate content by OAE staff, the comment will be removed without notice. If you have any queries or need any help, please contact us at support@oaepublish.com.