
Omics analyses provide insights to CART cell therapy resistance
 0
0Abstract
Chimeric antigen receptor T (CART) cell therapy has revolutionized the treatment of relapsed/refractory B cell malignancies in recent years. Despite high initial response rates, durable response rates are low, and CART cell efficacy in solid tumors is very modest. Additionally, the overall success of CART cell therapy is limited by toxicities such as cytokine release syndrome and neurotoxicity. Decades of advancement in genome sequencing technology and bioinformatics have given us a better understanding of how cancer develops and evolves following treatments. This has resulted in a better understanding of patient response to cancer treatment on a molecular level. Resistance to CART cell therapy can be mediated by the cancer cells, the tumor microenvironment, or the patient’s T cells. In this review, we will outline lessons learned from multi-omics studies (1) to identify biomarkers of response or toxicity to CART cell therapy or (2) to develop biomarker-guided therapeutic interventions to overcome these limitations.
Keywords
INTRODUCTION
Over the last five years, chimeric antigen receptor T (CART) cell therapy has emerged as a new therapeutic strategy in the treatment of diseases[1]. In addition to surgery, chemotherapy, and radiation, CART cell therapy has become a fourth pillar in the treatment of cancer[2]. Although the first FDA approval of a CART product was achieved only in 2017[3,4], the concept of a chimeric antigen receptor (CAR) was first pioneered by Gross et al.[5] in 1989, and the latest clinical successes are the result of decades of incremental scientific advancements in the fields of immunology, molecular biology, and tissue culture. A CAR is a recombinant protein composed of the single chain variable fragment from a monoclonal antibody, which is fused to a transmembrane domain and the intracellular signaling domains of the T cell[6]. The first design contained a single CD3ζ signaling domain, and while it showed promise in vitro, the clinical activity was minimal[6]. The second generation, now-FDA-approved CART cells use CD3ζ coupled with an additional co-stimulatory domain (e.g., 4-1BB or CD28)[7].
The process of generating CART cells is complex. First, patients’ peripheral blood mononuclear cells are harvested through a process called apheresis. Next, their isolated T cells are stimulated ex vivo to expand T cells and introduce the CAR transgene. Following transfection, T cells are expanded for 1-2 weeks before they are reintroduced into the patients. This process takes 3-4 weeks from apheresis to reinfusion of CART cells back into patients[1].
Over the last decade, CD19-directed CART cell (CART19) therapy has yielded unprecedented outcomes in patients with B cell malignancies. In patients with relapsed, refractory B-acute lymphoblastic leukemia (ALL) where prognosis is dismal, a single treatment with CART19 therapy resulted in a complete remission of 80%-90% of patients and durable remissions beyond 2 years in 50%-60% of patients, highlighting the curative potential of the therapy[3,8]. Similar results were achieved in lymphoma and multiple myeloma, leading to the FDA approval of five different therapies thus far[9,10].
Despite the success and FDA approval of multiple CART cell therapies, its wider application is limited by the development of resistance and life-threatening toxicities. While the initial response rates to CART19 in B cell malignancies are high, most patients relapse within the first two years[10,11]. Moreover, CART cell activity in solid tumors is very limited and objective responses are rarely seen[12]. While CART cells are found at the tumor site in solid tumor models such as glioblastoma and mesothelioma, the T cells seem to be rendered dysfunctional by the tumor microenvironment (TME)[13-15].
The administration of CART cell therapy is also associated with life-threatening toxicities, namely cytokine release syndrome (CRS) and/or neurotoxicity[1]. CRS is related to extreme elevation of cytokines correlating with T cell proliferation in vivo and presents as hypotension and respiratory failure, occasionally leading to deaths[1]. The pathophysiology of neurotoxicity is not well understood, but mechanistic studies point toward a role for myeloid cell activation and their cytokines in the development of neurotoxicity[1].
A comprehensive understanding of the phenotypical, functional, and molecular state of T cells, tumor, and TME would allow (1) the identification of predictive biomarkers to identify non-responders and patients at risk of developing life-threatening toxicities; and (2) the development of strategies to overcome resistance and toxicities. Collectively, this suggests that the major limitations to CART cell therapy include: (1) resistance and inhibition; (2) the development of life-threatening toxicities; and (3) lack of predictive biomarkers for response and toxicities.
In parallel to advancements in CART cell therapy, genome sequencing also has a long history. The idea of somatic changes in the genome as a cause of cancer originated in the 1900s[16]. It was not until the 1970s that we began to link these changes to specific genes.
The first discussions of the human genome sequencing project began in the 1980s[17], but the sequencing didn’t begin until a decade later and wasn’t completed until early 2000s. Both the time needed to sequence and the cost of sequencing per genome have improved dramatically, and millions of genomes have been sequenced since then[18]. The thousand genomes project was completed in 2015 and played an important role in defining normal, non-deleterious genetic variation by providing a database of variant frequency[19,20]. The progression of laboratory techniques and public availability of genetic data not only allows us to better understand the development of cancer, but it also enlightens our therapeutic intervention. These technological advancements allow us to use genetics to characterize resistance and toxicity of CART cell therapy [Figure 1]. In this manuscript, we will review lessons learned from multi-omics studies to assess the response and toxicities after CART cell therapy (summarized in Table 1).
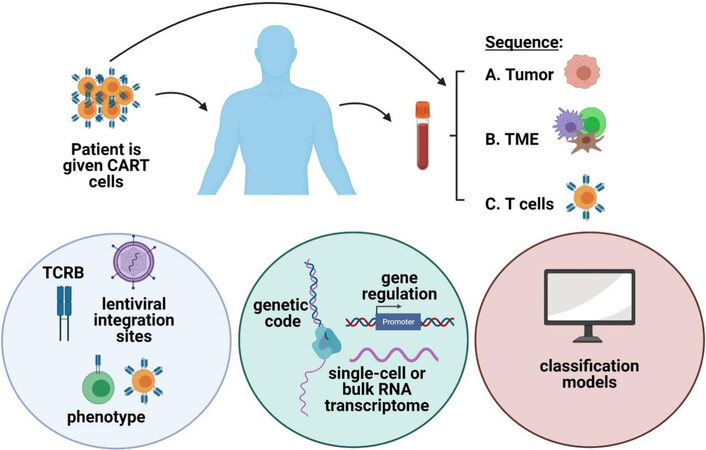
Figure 1. Omics strategies to uncover the mechanisms of resistance in CART cell therapy. Strategies involve studying (A) the tumor itself, (B) the TME, or (C) the T cells themselves. These studies are performed before and/or after infusion of CART cells. Studies specific to T cells include TCRB sequencing, lentiviral integration sites, and phenotype. DNA and RNA sequencing as well as gene regulation are studied. Classification models can also be created or used. Created with BioRender.com. CART: chimeric antigen receptor T cell; TME: tumor microenvironment; TCRB: T cell receptor beta; DNA: deoxyribonucleic acid; RNA: ribonucleic acid.
Summary of omic analyses in chimeric antigen receptor T cell therapy
| Sequencing type | Sample | Conclusion | Ref. |
| RNA sequencing | CART | Non-responders - exhausted CD8 phenotype Responders - memory phenotype | [22] |
| Whole exome sequencing ± CNV | Tumor | Classification genetic subtypes of DLBCL | [23] |
| TCRB sequencing, lentiviral integration site analysis RNA sequencing | CART | Some clones have a better survival capability | [24] |
| Lentiviral integration site analysis ATAC sequencing | CART | Lentiviruses preferentially incorporate into accessible chromatin AP-1 family is associated with activation and expansion | [26] |
| Single cell RNA, sequencing | CART | Monocyte-like gene expression signature associated with high-grade neurotoxicity | [22] |
| RNA sequencing | Brain tissue | A subset of mural cells expresses CD19 | [30] |
| RNA sequencing | TME | Monocytes acquire unique gene expression in the TME | [33] |
| RNA sequencing nanostring | TME | Lower T-cell-related genes and higher macrophage-related genes associated with neurotoxicity | [34] |
| Single cell RNA sequencing | TME | Upregulated PD-L1 in murine and human tumor | [36] |
| TCRB sequencing | TME | Specific clones of T cells survive better than others | [37] |
| Whole genome sequencing RNA sequencing | Tumor | Mechanism of antigen escape in occurs in exon 2 of CD19 and is regulated by SRSF3 splice factor | [41] |
| sgRNA sequencing | Tumor | Death receptor signature can predict response | [43] |
T CELL MOLECULAR STATE TO UNCOVER MECHANISMS OF RESISTANCE
Increasing evidence from correlative studies of clinical trials suggests that T cell fitness is an important determinant of CART cell response[21]. In order to generate CART cells, T cells undergo ex vivo activation, ex vivo expansion, and transduction or transfection to express the CAR transgene. After a period of 7-14 days, cell manufacturing is completed and CART cells are cryopreserved for their future use. The components that govern T cell fitness at the end of their expansion and manufacturing process are unclear. Critical T cell factors include expansion condition, stimulatory and co-stimulatory molecules used in the CAR design, T cell subsets, CART cell activation threshold, and the susceptibility to T cell exhaustion during the engineering process[21]. The optimal level of T cell activation in vivo to achieve adequate expansion and anti-tumor activity is unknown. It is also unknown how much T cell receptor stimulation contributes to CART cell activation, expansion, and response. The advancement of sequencing and computational tools allows us to uncover the answers to some of these questions using high-throughput data.
In an analysis of baseline CART19 products [Axicabtagene ciloleucel (Axi-Cel), CD28 co-stimulated CART19], transcriptome sequencing was used to reveal that non-responders to CART cell therapy had an increased population of exhausted CD8 T cells compared to a population of memory T cells in patients with complete response[22]. This is consistent with prior studies indicating a correlation between a baseline memory T cell phenotype with increased response after CART cell therapy[21]. The outcomes of these patients were also associated with cell-free DNA sequencing on day 7 after CART infusion. The patients who had a 5-fold decrease in tumor-related, cell-free DNA correlated with improved anti-tumor response at 3 months post infusion[22].
Another strategy is to study the molecular status of the tumor and the T cells simultaneously, in an attempt to identify a genetic signature or phenotype of CART cells and/or the tumor that would result in a specific outcome. A classification tool called LymphGen was created that inputs tumor biopsy results and uses a probabilistic model to output classification as one or more of the seven genetic subtypes of diffuse large B cell lymphoma (DLBCL)[23]. These subtypes differ in oncogenic signaling, genetic signature, TME, and survival rates[23]. This tool could lead to more precise CART cell therapies targeting a specific subtype of DLBCL.
In another strategy to understand the molecular state of CART cell therapy, T cell receptor beta (TCRB) sequencing, lentiviral integration sites analysis, and RNA sequencing on patient samples were simultaneously performed[24]. The investigators compared the infused CART cells to the expanded CART cells at 1-2 weeks and 26-30 days post infusion. TCRB sequencing revealed that while CART cells remain polyclonal, there is a decrease in clonal diversity over time[24], suggesting that specific clones may preferentially expand over time. Three patterns were observed: (1) steady proliferation; (2) immediate increase followed by a decrease; or (3) steady decline in number[24]. There was no clinical correlation associated with the kinetic patterns observed, nor was there a relationship to the vector integration site[24]. However, single cell RNA-sequencing revealed gene expression patterns associated with cytotoxicity and proliferation and enrichment of the AP-1 family, CD69, and glycolysis[24]. This suggested preferential expansion of T cell clones with this gene expression signature. They also saw higher expression of CD27[24], which correlates with previous transcriptomic analysis by Fraietta et al.[21], which revealed that an enriched population of CD27+CD45RO-CD8+ T cells prior to CART cell production were clinically associated with better outcomes in CLL patients. Understanding the phenotype or genetic features of the T cell clones with a better ability to proliferate or survive could inform the generation of a more effective CART cell therapy.
Several strategies to engineer T cells to express the CAR have been employed in the clinic. These include lentiviral transduction, retroviral transduction, transposon/transposase editing, and targeted CRISPR editing[25]. To date, the FDA-approved products are engineered using viral vectors. Lentiviruses integrate randomly and efficiently into the cell genome. In order to investigate how genetic alterations following lentivirus regulate CART cell functions in vivo, lentiviral integration sites in the genome of CD8+ T cells were examined from a healthy normal donor on day 9 of CART cell production by Wang et al.[26]. They were able to simultaneously assess both the accessibility of the chromatin and the site of CAR integration[26], which can then be measured on individual cells. They describe that integration of the CAR prefers inaccessible chromatin, which then leads to gain in chromatin accessibility at that site[26]. Their results suggest that lentiviruses prefer introns of transcriptionally active genes whereas retroviruses prefer accessible chromatin regions[26]. This might explain why tonic signaling is amplified in retrovirally transduced CAR compared to lentiviral methods[27]. Differentially accessible regions in the chromatin revealed clusters of naïve memory or effector T cells[26]. The AP-1 family (BATF and JUN) was associated with effector T cells and HMG proteins (TCF-1 and LEF2) associated with naïve or memory T cells[26]. Interestingly, both of these studies associated the AP-1 family to activation and expansion signatures in CART cells.
Activation and expansion are a delicate balance in CART cell therapy. Studies suggest that CART cells that undergo potent activation such as using CD28 as a co-stimulatory domain instead of 4-1BB may become exhausted, which leads to lack of persistence and loss of CART cells[28]. Understanding the genetic signature and gene regulation responsible for CART cell activation is a start to unraveling this complex problem. However, more detailed omics-directed studies will be needed to determine what equilibrium is required to achieve long-term expansion and persistence of CART cells.
TRANSCRIPTOMIC ANALYSIS TO UNCOVER MECHANISMS OF CART CELL TOXICITIES
While CRS and neurotoxicity after CART cell therapy are typically reversible, refractory cases and deaths have been reported. One study used single-cell sequencing to look at the association between the CART cell transcriptome and toxicity in patients with DLBCL[22]. Patients who developed high-grade neurotoxicity also had a population of cells at baseline with a gene expression signature similar to monocytes (i.e., CD68, LYZ, SPI1, LILRB4, and SIPRA) while not expressing the traditional monocyte markers, CD14 and CD16[22]. This population also expressed multiple cytokines and chemokines such as IL1B and IL8[22]. Understanding the origin and function of this subset of cells may either help determine risk prior to infusion or lead to strategies to prevent neurotoxicity[29]. This study corroborates prior correlative and preclinical studies which indicated a role for myeloid cells in the development of CRS and neurotoxicity.
Another group used single-cell RNA sequencing on brain tissue to try to determine the cause of neurotoxicity. They found a very small subset of CD19+ cells in the brain that also expressed CD248, indicating that they were mural cells[30]. While it is not yet known whether these mural cells are specifically responsible for neurotoxicity, it is possible that they are targeted once the blood brain barrier is disrupted during treatment. These cells are found with greater frequency in humans than mice, which highlights a limitation of using mouse models for neurotoxicity. This makes omics studies such as these the best modality to uncover the mechanisms that cause CART-induced toxicity in patients. This study also highlights what can be discovered using publicly available omics data, which can often be used to ask multiple questions.
USING OF OMICS TO INTERROGATE THE TME STATE FOLLOWING CART THERAPY
The TME is a complex system composed of a variety of cells which carry out their immunosuppressive functions using cell-to-cell signaling, cytokines, and extracellular vesicles[31]. These cells include regulatory T cells, myeloid-derived suppressor cells (MDSCs), and cancer-associated fibroblasts. TME components protect the tumor through the inhibition of effector immune cells and promotion of tumor growth. We and others have demonstrated that inhibitory myeloid cells, cancer-associated fibroblasts, and extracellular vesicles are capable of suppressing CART cell functions[29,31,32]. Interrogation of different components of the TME enables the development of strategies to overcome their inhibitory effects. It has been demonstrated that macrophages and monocytes acquire a specific transcriptomic signature in the presence of tumor cells, and that tumor-associated macrophages undergo continuous cross talks, driven by specific regulatory genes, such as TNFa, and CCL8[33].
A myeloid cell phenotype in the TME is also associated with response in CART cell therapy. In one study, tumor biopsies 1 month before CART cell infusion were characterized using RNA-sequencing or a nanostring panel of 770 genes found in the TME[34]. The group with severe neurotoxicity had significantly lower T-cell-related genes such as CD3, CD3ζ, FOXP3, ICOS, and CD62L[34]. The macrophage gene score was also significantly enriched in patients who relapsed after CART cell therapy as well as increased expression of the interferon-stimulated macrophage gene SIGLEC-1/CD169[35]. These data suggest that the TME is pre-conditioned for the level of T cell infiltration and myeloid cell response that will follow CART cell infusion.
Single-cell RNA-sequencing has been used to better understand the TME in a chemotherapy-resistant bladder cancer patient along with a parallel study in a patient-derived xenograft model[36]. The murine and human results both showed upregulation of programmed death ligand 1 (PD-L1) in the remaining tumor cells[36]. This informed a treatment decision to use anti-PD-L1 antibody, atezolizumab, which was successful[36]. This study highlights how sequencing data can be utilized to inform individualized treatment to overcome therapeutic resistance.
In metastatic melanoma, lessens are learned about tumor-infiltrating lymphocytes (TILs) in patients receiving BRAF inhibitors (BRAFi). TCRB sequencing was performed at baseline and after 10-14 days in patients receiving BRAFi to characterize a previously observed phenomenon that the number of TILs increase significantly in this amount of time after treatment[37]. They discovered that the clonality of the TILs increased and that the majority of these were new clones. However, the patients who already had the dominant clones prior to treatment with BRAFi achieved the best therapeutic response[37]. Like the CART cell study performed by Shieh et al.[24], this suggests that there are specific clones of T cells that expand or survive better than others.
GENETICS OF THE TUMOR AS A MECHANISM OF RELAPSE AND RESISTANCE
Tumor evolution and escape are major mechanisms of resistance to chemotherapy or to checkpoint blockade. Analysis of mutational burden has uncovered a novel mechanism of resistance to checkpoint blockade and led to the development of a FDA-approved test to predict response[38]. A predominant mechanism of relapse enacted by tumors in CART cell therapy is antigen escape[39]. The disease is able to escape detection by the CART19 because the proliferating leukemic cells no longer express CD19 and are not detected by the CAR. The initial complete response rate is 90%; however, 60%-70% of responders eventually relapse with a variant of CD19 that is undetectable by the CAR[3,40]. This phenomenon was seen in the first published phase I clinical trial of the CD19-directed 4-1BB-ζ CART cell therapy at the Children’s Hospital of Philadelphia[40]. The pre-treatment leukemic cells were analyzed and compared to the CD19-negative relapsed cells by performing whole genome sequencing and RNA sequencing[41]. These studies revealed that the primary mechanism of antigen escape occurs in exon 2 of the CD19 gene[41]. While frameshift mutations in exon 2 were observed in some of these cases, it did not appear to be the primary mechanism of the mutation[41]. This led the team to look at gene regulation. The AVISPA algorithm was used to predict which RNA-binding proteins are associated with a particular intron-exon site[42]. This algorithm revealed possible candidates for the regulation of CD19 exon 2, and regulation by SRSF3 splice factor was confirmed by immunoprecipitation and SRSF3 knockdown experiments[41].
A genetic signature for mutated death receptor pathways was recently identified as a novel mechanism of primary resistance to CART cell therapy in patients with ALL. In this study, a CRISPR/Cas9 library was used to generate a pool of single-gene-knockout cells in the ALL cell line Nalm6[43]. These were then co-cultured with CART19 cells and sgRNA sequencing was performed, which revealed gene enrichment for death receptor pathways[43]. This finding was corroborated by samples from two clinical trials in which the leukemic cells in non-responders had significantly lower death receptor signature expression compared to responders[43]. These data were used to create a predictive multivariate logistic regression model to predict treatment response based on death receptor signature[43], again confirming these findings.
CONCLUSION
The use of gene sequencing tools, the amount of genetics data available, and the bioinformatics tools to analyze these data have exploded in recent years. Over the next decade, we expect to see genomic sequencing incorporated into routine care. Non-invasive methods such as liquid biopsies to determine the risk of cancer development, the presence of cancer, or the efficacy of therapy is the future of oncology and precision medicine. Classification tools such as the one reviewed in this paper could help determine which treatment or dose of treatment will be effective to better inform clinical decisions. We would expect see such automated screening tools using genetic data in the not-so-distant future. As sequencing efficiency and cost continue to improve and more productive computational methods and pipelines are developed, personalized genomics will become a more attainable goal. The methods reviewed here have demonstrated to be useful in the field of CART cell therapy to investigate the genomic factors involved in therapeutic resistance initiated by the tumor, TME, or patient’s T cells. These studies will lead the way to future omics investigations and targeted therapies to overcome the current challenges in CART cell therapy.
DECLARATIONS
Authors’ contributionsDesigned the content of this review, wrote the manuscript, and approved the final version: Cox MJ, Kenderian SS
Availability of data and materialsNot applicable.
Financial support and sponsorshipThis work was partly supported through the Mayo Clinic K2R pipeline (SSK) the Mayo Clinic Center for Individualized Medicine (SSK), and the Predolin Foundation (SSK).
Conflicts of interestCox MJ and Kenderian SS are inventors on patents in the field of CART cell therapy that are licensed to Humanigen (through Mayo Clinic). Kenderian SS is an inventor on patents in the field of CAR immunotherapy that are licensed to Novartis (through an agreement between Mayo Clinic, University of Pennsylvania, and Novartis), and to Mettaforge (through Mayo Clinic). Kenderian SS receives research funding from Kite, Gilead, Juno, Celgene, Novartis, Humanigen, MorphoSys, Tolero, Sunesis, Leahlabs, and Lentigen. These disclosures are not directly related to the content of this manuscript.
Ethical approval and consent to participateNot applicable.
Consent for publicationNot applicable.
Copyright© The Author(s) 2021.
REFERENCES
1. Siegler EL, Kenderian SS. Neurotoxicity and cytokine release syndrome after chimeric antigen receptor T cell therapy: insights into mechanisms and novel therapies. Front Immunol 2020;11:1973.
3. Maude SL, Laetsch TW, Buechner J, et al. Tisagenlecleucel in children and young adults with B-cell lymphoblastic leukemia. N Engl J Med 2018;378:439-48.
4. Schuster SJ, Bishop MR, Tam CS, et al. JULIET Investigators. Tisagenlecleucel in adult relapsed or refractory diffuse large B-cell lymphoma. N Engl J Med 2019;380:45-56.
5. Gross G, Waks T, Eshhar Z. Expression of immunoglobulin-T-cell receptor chimeric molecules as functional receptors with antibody-type specificity. Proc Natl Acad Sci U S A 1989;86:10024-8.
6. Eshhar Z, Waks T, Gross G, Schindler DG. Specific activation and targeting of cytotoxic lymphocytes through chimeric single chains consisting of antibody-binding domains and the gamma or zeta subunits of the immunoglobulin and T-cell receptors. Proc Natl Acad Sci U S A 1993;90:720-4.
7. Maus MV, Grupp SA, Porter DL, June CH. Antibody-modified T cells: CARs take the front seat for hematologic malignancies. Blood 2014;123:2625-35.
8. Park JH, Rivière I, Gonen M, et al. Long-term follow-up of CD19 CAR therapy in acute lymphoblastic leukemia. N Engl J Med 2018;378:449-59.
9. Palumbo A, Hajek R, Delforge M, et al. MM-015 Investigators. Continuous lenalidomide treatment for newly diagnosed multiple myeloma. N Engl J Med 2012;366:1759-69.
10. Raje N, Berdeja J, Lin Y, et al. Anti-BCMA CAR T-Cell therapy bb2121 in relapsed or refractory multiple myeloma. N Engl J Med 2019;380:1726-37.
11. Xu X, Sun Q, Liang X, et al. Mechanisms of relapse after CD19 CAR T-cell therapy for acute lymphoblastic leukemia and its prevention and treatment strategies. Front Immunol 2019;10:2664.
12. Ma S, Li X, Wang X, et al. Current progress in CAR-T cell therapy for solid tumors. Int J Biol Sci 2019;15:2548-60.
13. Beatty GL, Haas AR, Maus MV, et al. Mesothelin-specific chimeric antigen receptor mRNA-engineered T cells induce anti-tumor activity in solid malignancies. Cancer Immunol Res 2014;2:112-20.
14. Brown CE, Alizadeh D, Starr R, et al. Regression of glioblastoma after chimeric antigen receptor T-cell therapy. N Engl J Med 2016;375:2561-9.
15. Johnson LA, Scholler J, Ohkuri T, et al. Rational development and characterization of humanized anti-EGFR variant III chimeric antigen receptor T cells for glioblastoma. Sci Transl Med 2015;7:275ra22.
16. Wunderlich V. Early references to the mutational origin of cancer. Int J Epidemiol 2007;36:246-7.
17. Dulbecco R. A turning point in cancer research: sequencing the human genome. Science 1986;231:1055-6.
18. Yngvadottir B, Macarthur DG, Jin H, Tyler-Smith C. The promise and reality of personal genomics. Genome Biol 2009;10:237.
19. Abecasis GR, Altshuler D, Auton A, et al. 1000 Genomes Project Consortium. A map of human genome variation from population-scale sequencing. Nature 2010;467:1061-73.
21. Fraietta JA, Lacey SF, Orlando EJ, et al. Determinants of response and resistance to CD19 chimeric antigen receptor (CAR) T cell therapy of chronic lymphocytic leukemia. Nat Med 2018;24:563-71.
22. Deng Q, Han G, Puebla-Osorio N, et al. Characteristics of anti-CD19 CAR T cell infusion products associated with efficacy and toxicity in patients with large B cell lymphomas. Nat Med 2020;26:1878-87.
23. Wright GW, Huang DW, Phelan JD, et al. A probabilistic classification tool for genetic subtypes of diffuse large B cell lymphoma with therapeutic implications. Cancer Cell 2020;37:551-568.e14.
24. Sheih A, Voillet V, Hanafi LA, et al. Clonal kinetics and single-cell transcriptional profiling of CAR-T cells in patients undergoing CD19 CAR-T immunotherapy. Nat Commun 2020;11:219.
25. Manriquez-Roman C, Siegler EL, Kenderian SS. CRISPR takes the front seat in CART-cell development. BioDrugs 2021;35:113-24.
26. Wang W, Fasolino M, Cattau B, et al. Joint profiling of chromatin accessibility and CAR-T integration site analysis at population and single-cell levels. Proc Natl Acad Sci U S A 2020;117:5442-52.
27. Gomes-Silva D, Mukherjee M, Srinivasan M, et al. Tonic 4-1BB costimulation in chimeric antigen receptors impedes T cell survival and is vector-dependent. Cell Rep 2017;21:17-26.
28. Long AH, Haso WM, Shern JF, et al. 4-1BB costimulation ameliorates T cell exhaustion induced by tonic signaling of chimeric antigen receptors. Nat Med 2015;21:581-90.
29. Sterner RM, Sakemura R, Cox MJ, et al. GM-CSF inhibition reduces cytokine release syndrome and neuroinflammation but enhances CAR-T cell function in xenografts. Blood 2019;133:697-709.
30. Parker KR, Migliorini D, Perkey E, et al. Single-cell analyses identify brain mural cells expressing CD19 as potential off-tumor targets for CAR-T immunotherapies. Cell 2020;183:126-142.e17.
31. Cox MJ, Lucien F, Sakemura R, et al. Leukemic extracellular vesicles induce chimeric antigen receptor T cell dysfunction in chronic lymphocytic leukemia. Mol Ther 2021;29:1529-40.
32. Sakemura R, Cox MJ, Hansen MJ, et al. Targeting cancer associated fibroblasts in the bone marrow prevents resistance to chimeric antigen receptor T cell therapy in multiple myeloma. Blood 2019;134:865.
33. Cassetta L, Fragkogianni S, Sims AH, et al. Human tumor-associated macrophage and monocyte transcriptional landscapes reveal cancer-specific reprogramming, biomarkers, and therapeutic targets. Cancer Cell 2019;35:588-602.e10.
34. Jain MD, Faramand R, Staedtke V, et al. The lymphoma tumor microenvironment influences toxicity after CD19 CAR T cell therapy. Blood 2019;134:4105.
35. Jain MD, Zhao H, Atkins R, et al. Tumor inflammation and myeloid derived suppressor cells reduce the efficacy of CD19 CAR T cell therapy in lymphoma. Blood 2019;134:2885.
36. Lee HW, Chung W, Lee HO, et al. Single-cell RNA sequencing reveals the tumor microenvironment and facilitates strategic choices to circumvent treatment failure in a chemorefractory bladder cancer patient. Genome Med 2020;12:47.
37. Cooper ZA, Frederick DT, Juneja VR, et al. BRAF inhibition is associated with increased clonality in tumor-infiltrating lymphocytes. Oncoimmunology 2013;2:e26615.
38. Marabelle A, Fakih M, Lopez J, et al. Association of tumour mutational burden with outcomes in patients with advanced solid tumours treated with pembrolizumab: prospective biomarker analysis of the multicohort, open-label, phase 2 KEYNOTE-158 study. Lancet Oncol 2020;21:1353-65.
39. Majzner RG, Mackall CL. Tumor antigen escape from CAR T-cell therapy. Cancer Discov 2018;8:1219-26.
40. Maude SL, Frey N, Shaw PA, et al. Chimeric antigen receptor T cells for sustained remissions in leukemia. N Engl J Med 2014;371:1507-17.
41. Sotillo E, Barrett DM, Black KL, et al. Convergence of acquired mutations and alternative splicing of CD19 enables resistance to CART-19 immunotherapy. Cancer Discov 2015;5:1282-95.
42. Barash Y, Vaquero-Garcia J, González-Vallinas J, et al. AVISPA: a web tool for the prediction and analysis of alternative splicing. Genome Biol 2013;14:R114.
Cite This Article
Export citation file: BibTeX | RIS
OAE Style
Cox MJ, Kenderian SS. Omics analyses provide insights to CART cell therapy resistance. J Transl Genet Genom 2021;5:80-8. http://dx.doi.org/10.20517/jtgg.2021.06
AMA Style
Cox MJ, Kenderian SS. Omics analyses provide insights to CART cell therapy resistance. Journal of Translational Genetics and Genomics. 2021; 5(2): 80-8. http://dx.doi.org/10.20517/jtgg.2021.06
Chicago/Turabian Style
Cox, Michelle J., Saad S. Kenderian. 2021. "Omics analyses provide insights to CART cell therapy resistance" Journal of Translational Genetics and Genomics. 5, no.2: 80-8. http://dx.doi.org/10.20517/jtgg.2021.06
ACS Style
Cox, MJ.; Kenderian SS. Omics analyses provide insights to CART cell therapy resistance. J. Transl. Genet. Genom. 2021, 5, 80-8. http://dx.doi.org/10.20517/jtgg.2021.06
About This Article
Special Issue
Copyright

Data & Comments
Data
0

 Cite This Article 7 clicks

 Like This Article 28
likes
Like This Article 28
likes


Comments
Comments must be written in English. Spam, offensive content, impersonation, and private information will not be permitted. If any comment is reported and identified as inappropriate content by OAE staff, the comment will be removed without notice. If you have any queries or need any help, please contact us at support@oaepublish.com.