
Duo Shared Genomic Segment analysis identifies a genome-wide significant risk locus at 18q21.33 in myeloma pedigrees
 0
0Abstract
Aim: High-risk pedigrees (HRPs) are a powerful design to map highly penetrant risk genes. We previously described Shared Genomic Segment (SGS) analysis, a mapping method for single large extended pedigrees that also addresses genetic heterogeneity inherent in complex diseases. SGS identifies shared segregating chromosomal regions that may inherit in only a subset of cases. However, single large pedigrees that are individually powerful (at least 15 meioses between studied cases) are scarce. Here, we expand the SGS strategy to incorporate evidence from two extended HRPs by identifying the same segregating risk locus in both pedigrees and allowing for some relaxation in the size of each HRP.
Methods: Duo-SGS is a procedure to combine single-pedigree SGS evidence. It implements statistically rigorous duo-pedigree thresholding to determine genome-wide significance levels that account for optimization across pedigree pairs. Single-pedigree SGS identifies optimal segments shared by case subsets at each locus across the genome, with nominal significance assessed empirically. Duo-SGS combines the statistical evidence for SGS segments at the same genomic location in two pedigrees using Fisher’s method. One pedigree is paired with all others and the best duo-SGS evidence at each locus across the genome is established. Genome-wide significance thresholds are determined through distribution-fitting and the Theory of Large Deviations. We applied the duo-SGS strategy to eleven extended, myeloma HRPs.
Results: We identified one genome-wide significant region at 18q21.33 (0.85 Mb, P = 7.3 × 10⁻⁹) which contains one gene, CDH20. Thirteen regions were genome-wide suggestive: 1q42.2, 2p16.1, 3p25.2, 5q21.3, 5q31.1, 6q16.1, 6q26, 7q11.23, 12q24.31, 13q13.3, 18p11.22, 18q22.3 and 19p13.12.
Conclusion: Our results provide novel risk loci with segregating evidence from multiple HRPs and offer compelling targets and specific segment carriers to focus a future search for functional variants involved in inherited risk formyeloma.
Keywords
Introduction
Multiple myeloma (MM) is the second most common adult-onset lymphoid neoplasm and has the worst 5-year survival[1]. Inherited germline susceptibility for MM is consistently supported[2]: excess MM risk among relatives has been observed in family aggregation[3,4], epidemiologic case-control[5-9], and registry-based[10,11] studies. Disease rarity, short survival, clinical and locus heterogeneity challenge study ascertainment and genetic discovery[12]. Genome-wide association studies have identified 23 loci harboring common-risk single nucleotide polymorphisms (SNPs) for MM[13-19]. Family-based studies have identified rare germline variants in ARID1A and USP45[20], KDM1A[21], and DIS3[22] in exome sequencing. However, considerable missing heritability remains. Additional approaches are needed to aid the detection of the remaining risk loci and genes.
We recently described a novel strategy to map genes involved in complex disease risk using extremely large high-risk pedigrees and allowing for intra-familial heterogeneity, called Shared Genomic Segment (SGS)[20]. Cases sharing genomic segments from a common ancestor through 15 meioses or more are unexpected at a genome-wide level[23], and hence a single large high-risk pedigree (HRP) can provide the power to identify novel loci with genome-wide significance[24]. Our resource of eleven large myeloma pedigrees included several with 3-4 cases and meioses in the 8-14 range[20]. While these remain extremely large families, they may lack sufficient power individually for genome-wide significance. Also, a multi-pedigree strategy is attractive. Evidence for the same risk locus in two extended pedigrees adds confidence to the locus and can build on the power of both. The remaining challenge for any multi-pedigree approach, however, is to adequately address heterogeneity between pedigrees[25].
Here, we expand the SGS method based on combining evidence from pairs of HRPs, while still allowing for intra-familial heterogeneity within each pedigree. In our approach, duo-SGS, we fix one pedigree and optimize over all pedigree pairs to balance discovery with multiple testing. Both pedigrees must have a segregating genomic segment at the same risk locus. The method is robust to allelic heterogeneity as different alleles at the same locus may be shared within each pedigree. We apply the duo-SGS approach to eleven MM HRPs to identify novel loci involved in myeloma risk.
Methods
Duo-SGS method
An overview of the duo-SGS approach can be found in Figure 1. After identifying HRPs and genotyping cases, the observed shared genomic segments in single pedigrees are established and compared between pedigrees, and genome-wide thresholds are determined.
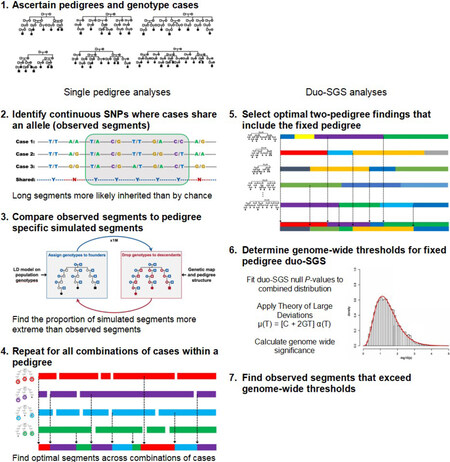
Figure 1. Overview of the duo-SGS method. SGS: Shared genomic segment; SNP: single nucleotide polymorphism.
Observed duo-SGS sharing
The single pedigree SGS approach has been described previously[20]. Briefly, the single SGS approach identifies shared observed genomic segments by defining consecutive runs of SNPs that are identity-by-state in a group of cases (Figure 1, Step 2). If the length of an observed segment is significantly longer than it would be by chance, inherited sharing (identity-by-descent) is implied. The nominal significance of each segment is assessed empirically. Expected length sharing under the null hypothesis is generated using a gene-dropping algorithm (Figure 1, Step 3). Chromosomes are assigned to the pedigree founders (those with no parents in the pedigree) randomly and according to a population linkage disequilibrium model. These simulated chromosomes are “dropped” through the pedigree structure using Mendelian inheritance expectations according to a genetic map for recombination. All members of the pedigree receive genotypes under the null hypothesis, and simulated genomic segments from this null configuration are established. These simulations are repeated at least one million times. The empirical P-value for an observed segment is the proportion of simulated segments that are identical or encompass the observed segment to the number of simulations. All subsets of at least two cases within a pedigree are assessed for observed segments. Then, at every position across the genome, the best evidence (lowest empirical P-value) for an excessive length of sharing is established (Figure 1, Step 4). This process results in a final optimized set of shared segments for a single pedigree. Each optimal segment corresponds to a specific subset of cases and has a nominal empirical P-value.
For two pedigrees, the duo-SGS evidence is the combination of the nominal empirical P-values for the optimal segments at the same genome position in the two pedigrees. Specifically, the Fisher method to combine P-values was used. All possible pedigree pairs could be considered as separate analyses, but there are  pedigree pairs (ways to select 2 pedigrees from n total pedigrees), and hence multiple testing can rapidly become an issue. Alternatively, a single analysis comprising optimization across all pedigree pairs could be considered, but this global approach may cloud individual pedigree-pair findings. To balance these two extremes, we propose a fixed-pedigree duo-SGS strategy (Figure 1, Step 5). The procedure is as follows: (1) fix a pedigree of interest; (2) calculate genome-wide duo-SGS evidence for the fixed pedigree with each of the other pedigrees; and (3) optimize across the duo-SGS findings to identify the most significant duo-SGS result at each point across the genome. The optimized findings over pedigree pairs are the duo-SGS results for the fixed pedigree. In this approach, we identify the best two-pedigree results that include the fixed pedigree. The procedure is then repeated for each pedigree, thus producing duo-SGS results for each pedigree.
Genome-wide thresholds for duo-SGS
Critical to interpreting the observed duo-SGS results are genome-wide significance duo-SGS thresholds for each pedigree (Figure 1, Step 6). To establish these, we echo the same optimization process in null data. Establishing these thresholds is similar to the calculation described for the single pedigree SGS method[20]. Under the reasonable assumption that the vast majority of the genome represents chance sharing (i.e., most of the genome does not contain a disease risk gene) we model the distribution for null sharing on the distribution of the empirical P-values for each pedigree. To avoid comparing the findings to themselves or skewing to possible true-positives, the empirical-P-values are perturbed, and the distribution-fitting is performed at 1 million simulations. The latter is to avoid inappropriate distribution-fitting to extreme outliers, the few results from the alternate hypothesis if included at their final resolution. To perturb an empirical P-value we determine its Wilson score 95% confidence interval (CI) (Equation 1) and randomly sample a value from within it.
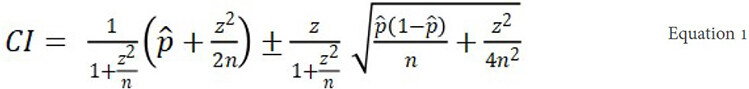
where p̂ is the empirical P-value, z is 1.96 (for the 95%CI), and n is the number of simulations (here, 1,000,000). The Wilson interval was selected because it always produces non-negative confidence bounds for the P-values. The genome-wide set of perturbed empirical P-values for a pedigree are considered the “null” P-values for that single pedigree. The duo-SGS procedure (described above) is performed using the single pedigree genome-wide null P-values. The result of this process is a set of optimal duo-SGS null P-values.
Genome-wide significant and suggestive thresholds are determined following our previously described method for single pedigree SGS[20]. Briefly, the null duo-SGS P-values are log-transformed and fitted to a gamma distribution. The shape (k) and rate (σ) parameters of the fitted distribution are applied using the Theory of Large Deviations to calculate the significance thresholds by solving:

where μ(X) is the genome-wide false positive rate, C is the number of chromosomes, α(X) is the probability of exceeding  , and G is the genome length in Morgans[26]. The false-positive rate is set to 0.05 for the genome-wide significant threshold and 1.0 for the genome-wide suggestive threshold. After solving for X, the threshold, T is determined by
  . Thresholds are specific to each fixed pedigree to assess their duo-SGS results.
MM high-risk pedigrees
The statewide Utah Cancer Registry (UCR) has been an NCI-supported Surveillance, Epidemiology, and End Results (SEER) Program registry since its inception in 1966. The UCR was utilized to invite all individuals with myeloma in the state to participate. Peripheral blood was collected for DNA extraction from individuals who completed informed consent.
The Utah Population Database (UPDB) is a unique resource[27]. It includes a 16-generation genealogy of approximately 5 million people with at least one event in Utah that is record-linked to the UCR and state vital records. Using the UPDB, ancestors whose descendants have an excess of disease based on internal cancer rates and years at risk can be identified and studied as HRPs. The UPDB was used to identify ancestors whose descendants showed a statistical excess of MM (P < 0.05). The expectation was based on internal disease rates based on birth cohort, sex, birthplace (in/outside Utah), and years at risk. The total number of myeloma cases in each HRP identified ranged from 4 to 37 cases. After annotating the pedigrees with those with DNA, 11 pedigrees were identified to contain 3 or 4 myeloma cases with DNA (28 individuals; 8 individuals were in more than one pedigree). In each pedigree, the cases were separated by 8 to 23 meioses.
DNA from the 28 cases was genotyped on the Illumina Omni Express high-density SNP array at the University of Utah. Only high-quality bi-allelic SNPs and individuals with adequate call rates across the genome were included. The PLINK software[28] was used for quality control. SNPs with < 95% call rate across the 28 individuals were removed. After filtering, 678,447 SNPs remained. These SNPs were transformed to match 1000Genomes strand orientation.
Individuals were removed if < 90% of the filtered SNPs are called. One myeloma case had a < 90% call rate and was eliminated from the study. We also checked for sex inconsistency based on the genotypes - all cases passed. PLINK relationship estimates were compared with the UPDB pedigree structures - no issues were found.
The duo-SGS method was applied to the MM pedigrees to identify regions with genome-wide suggestive or significant evidence. Post-hoc, some duo-SGS regions were removed from consideration. Duplicate regions occur when the same pair of pedigrees identify the same region in both their fixed-pedigree results. In these situations, duo-SGS P-values are identical, but thresholds vary by which pedigree is fixed, potentially leading to different significance levels. The most significant result was reported, and the lesser removed. If an individual resided in two pedigrees and also shared the region in both pedigrees, the region was removed. If the region spanned a centromere, it was removed. Forty-two suggestive regions were removed as duplicates, involving an overlap individual or at the centromere.
Results
Duo-SGS findings were identified for each of the eleven MM HRPs. The significance thresholds for each fixed pedigree are in Table 1. One region at 18q21.33 reached genome-wide significance and 13 regions were genome-wide suggestive. Table 2 shows the details of the significant or suggestive regions identified, including the duo-SGS P-value, expected rate per genome μ(t), the two pedigrees involved, each segregating shared region in the pedigrees, and the overlapping region.
Multiple myeloma high-risk pedigrees and duo-SGS thresholds
| Pedigree | Multiple myeloma cases | Duo-SGS thresholds | |||
|---|---|---|---|---|---|
| Total | Genotyped | Meioses | Significant | Suggestive | |
| 260 | 31 | 3 | 16 | 3.82 × 10⁻⁸ | 4.31 × 10⁻⁷ |
| 2122 | 5 | 3 | 18 | 3.10 × 10⁻⁸ | 3.66 × 10⁻⁷ |
| 4823 | 4 | 3 | 13 | 1.02 × 10⁻⁷ | 8.92 × 10⁻⁷ |
| 20245 | 4 | 3 | 13 | 8.56 × 10⁻⁸ | 7.71 × 10⁻⁷ |
| 34955 | 12 | 3 | 16 | 3.94 × 10⁻⁸ | 4.35 × 10⁻⁷ |
| 48833 | 20 | 4 | 23 | 1.01 × 10⁻⁸ | 1.21 × 10⁻⁷ |
| 546699 | 14 | 2 | 11 | 2.21 × 10⁻⁷ | 1.92 × 10⁻⁶ |
| 549917 | 18 | 4 | 21 | 1.11 × 10⁻⁸ | 1.29 × 10⁻⁷ |
| 571744 | 37 | 3 | 20 | 2.23 × 10⁻⁸ | 2.90 × 10⁻⁷ |
| 576834 | 9 | 4 | 16 | 2.80 × 10⁻⁸ | 2.61 × 10⁻⁷ |
| 651626 | 6 | 3 | 13 | 8.32 × 10⁻⁸ | 7.50 × 10⁻⁷ |
Duo-SGS genome-wide significant and suggestive regions
| Locus | Duo-SGS | Fixed pedigree | Duo pedigree | |||||||||||
|---|---|---|---|---|---|---|---|---|---|---|---|---|---|---|
| P-value | μ(t) | MB | Region | Ped ID | P-value | MB | Region | N | Ped ID | P-value | MB | Region | N | |
| 1q42.2 | 1.08 × 10⁻⁶ | 0.464 | 0.34 | 233,695,394-234,039,857 | 546699 | 1.62 × 10⁻³ | 1.22 | 233,288,913-234,508,704 | 2 | 549917 | 3.80 × 10⁻⁵ | 0.34 | 233,695,394-234,039,857 | 4 |
| 2p16.1 | 2.43 × 10⁻⁷ | 0.911 | 0.11 | 56,267,182-56,374,910 | 576834 | 6.70 × 10⁻⁵ | 0.83 | 56,267,182-57,098,139 | 4 | 48833 | 1.89 × 10⁻⁴ | 1.05 | 55,327,407-56,374,910 | 3 |
| 3p25.2 | 2.81 × 10⁻⁷ | 0.964 | 1.07 | 12,006,892-13,075,760 | 571744 | 1.80 × 10⁻⁴ | 2.03 | 11,092,264-13,117,999 | 2 | 48833 | 8.20 × 10⁻⁵ | 1.07 | 12,006,892-13,075,760 | 3 |
| 5q21.3 | 5.36 × 10⁻⁸ | 0.354 | 0.02 | 107,141,104-107,158,158 | 549917 | 4.30 × 10⁻⁴ | 0.36 | 106,800,148-107,158,158 | 3 | 48833 | 6.00 × 10⁻⁶ | 0.85 | 107,141,104-107,994,565 | 4 |
| 5.27 × 10⁻⁷ | 0.630 | 0.64 | 107,141,104-107,784,684 | 651626 | 4.78 × 10⁻³ | 0.64 | 107,140,556-107,784,684 | 3 | ||||||
| 3.15 × 10⁻⁷ | 0.840 | 0.85 | 107,141,104-107,994,565 | 2122 | 2.78 × 10⁻³ | 1.69 | 107,118,121-108,803,319 | 2 | ||||||
| 5q31.1 | 1.99 × 10⁻⁷ | 0.396 | 0.30 | 133,295,892-133,591,127 | 260 | 1.83 × 10⁻⁴ | 0.58 | 133,011,503-133,591,127 | 3 | 549917 | 5.60 × 10⁻⁵ | 1.30 | 133,295,892-134,597,267 | 3 |
| 6q16.1 | 8.60 × 10⁻⁸ | 0.250 | 1.71 | 98,528,404-100,243,033 | 571744 | 2.50 × 10⁻⁶ | 1.75 | 98,495,952-100,243,033 | 3 | 549917 | 1.70 × 10⁻³ | 2.78 | 98,528,404-101,304,411 | 2 |
| 7.81 × 10⁻⁸ | 0.121 | 1.23 | 99,013,740-100,243,033 | 34955 | 1.53 × 10⁻³ | 1.59 | 99,013,740-100,606,568 | 2 | 571744 | 2.50 × 10⁻⁶ | 1.75 | 98,495,952-100,243,033 | 3 | |
| 3.99 × 10⁻⁷ | 0.341 | 0.98 | 98,495,952-99,478,304 | 4823 | 8.55 × 10⁻³ | 2.39 | 97,093,259-99,478,304 | 2 | ||||||
| 6.03 × 10⁻⁷ | 0.752 | 0.48 | 98,495,952-98,980,113 | 651626 | 1.32 × 10⁻² | 0.80 | 98,177,018-98,980,113 | 3 | ||||||
| 2.31 × 10⁻⁷ | 0.856 | 0.35 | 99,893,527-100,243,033 | 576834 | 4.81 × 10⁻³ | 0.40 | 99,893,527-100,293,531 | 3 | ||||||
| 6q26 | 1.61 × 10⁻⁷ | 0.379 | 0.48 | 162,474,893-162,957,575 | 2122 | 1.53 × 10⁻³ | 1.04 | 162,250,522-163,291,300 | 2 | 48833 | 5.33 × 10⁻⁶ | 0.48 | 162,474,893-162,957,575 | 4 |
| 1.30 × 10⁻⁶ | 0.595 | 0.23 | 162,724,247-162,957,575 | 546699 | 1.40 × 10⁻² | 0.82 | 162,724,247-163,544,705 | 2 | ||||||
| 6.20 × 10⁻⁷ | 0.752 | 0.31 | 162,615,606-162,928,898 | 20245 | 6.38 × 10⁻³ | 0.31 | 162,615,606-162,928,898 | 3 | ||||||
| 8.73 × 10⁻⁷ | 0.971 | 0.28 | 162,474,893-162,752,050 | 4823 | 9.17 × 10⁻³ | 0.30 | 162,450,471-162,752,050 | 3 | ||||||
| 7q11.23 | 4.09 × 10⁻⁸ | 0.255 | 1.37 | 75,441,794-76,813,298 | 549917 | 2.90 × 10⁻⁵ | 1.66 | 75,441,794-77,098,772 | 3 | 48833 | 6.70 × 10⁻⁵ | 1.59 | 75,222,070-76,813,298 | 3 |
| 1.50 × 10⁻⁶ | 0.720 | 1.66 | 75,442,855-77,098,772 | 546699 | 3.00 × 10⁻³ | 2.22 | 75,442,855-77,663,486 | 2 | 549917 | 2.90 × 10⁻⁵ | 1.66 | 75,441,794-77,098,772 | 3 | |
| 12q24.31 | 4.50 × 10⁻⁷ | 0.494 | 0.11 | 121,438,844-121,547,455 | 20245 | 9.34 × 10⁻⁴ | 1.16 | 120,388,858-121,547,455 | 3 | 571744 | 2.60 × 10⁻⁵ | 1.59 | 121,438,844-123,030,788 | 3 |
| 13q13.3 | 2.66 × 10⁻⁷ | 0.689 | 0.13 | 36,297,517-36,424,698 | 2122 | 3.60 × 10⁻⁵ | 1.12 | 35,308,299-36,424,698 | 3 | 48833 | 3.87 × 10⁻⁴ | 0.24 | 36,297,517-36,537,635 | 4 |
| 18p11.22 | 6.48 × 10⁻⁷ | 0.799 | 0.17 | 9,693,654-9,866,696 | 20245 | 2.90 × 10⁻³ | 0.19 | 9,693,654-9,878,670 | 3 | 571744 | 1.23 × 10⁻⁵ | 0.58 | 9,285,824-9,866,696 | 3 |
| 18q21.33 | 7.30 × 10⁻⁹ | 0.029 | 0.85 | 58,208,260-59,059,262 | 549917 | 2.80 × 10⁻⁵ | 1.22 | 57,945,602-59,167,836 | 3 | 48833 | 1.14 × 10⁻⁵ | 0.85 | 58,208,260-59,059,262 | 4 |
| 18q22.3 | 2.72 × 10⁻⁷ | 0.569 | 0.20 | 68,834,971-69,039,896 | 34955 | 2.80 × 10⁻⁴ | 0.68 | 68,357,156-69,039,896 | 3 | 48833 | 5.10 × 10⁻⁵ | 0.43 | 68,834,971-69,260,566 | 4 |
| 19p13.12 | 9.82 × 10⁻⁷ | 0.406 | 0.44 | 15,773,427-16,217,107 | 546699 | 2.64 × 10⁻³ | 1.32 | 15,773,427-17,090,612 | 2 | 571744 | 2.10 × 10⁻⁵ | 0.57 | 15,648,456-16,217,107 | 3 |
The genome-wide significant region at 18q21.33 [duo-SGS P = 7.3 × 10⁻⁹, μ(t) = 0.029] was found in pedigree pair UT-549917/UT-48833. A 1.2 Mb chromosomal segment (chromosome 18 57,945,602-59,167,836 bp) segregated to three MM cases separated by 17 meioses in pedigree UT-549917 (single pedigree P = 2.8 × 10⁻⁵). A nested 0.8 Mb chromosomal segment (58,208,260-59,059,262 bp) was observed in four MM cases separated by 23 meioses in pedigree UT-48833 (single pedigree P = 1.1 × 10⁻⁵). The intersecting 0.8 Mb region overlaps one gene: Cadherin 20 (CDH20). Figure 2 shows the two regions and the overlap.
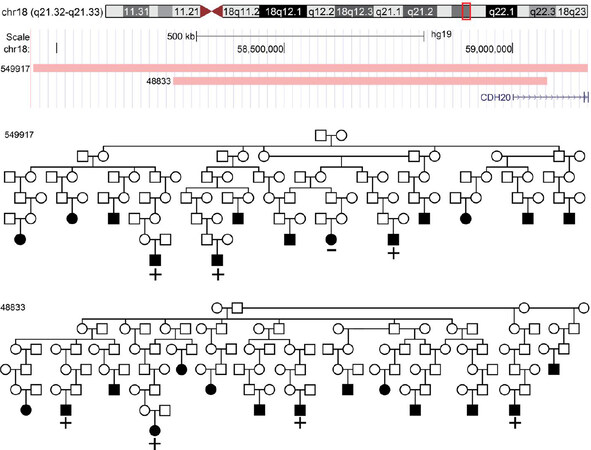
Figure 2. Duo-SGS genome-wide significant region. +/- indicates genotyped cases and SGS carrier status. Squares indicate male and circles female. Filled in shapes have a MM diagnosis. Pedigrees are trimmed to descendants with a MM case. SGS: Shared genomic segment; MM: multiple myeloma.
Thirteen loci were found with genome-wide suggestive evidence [Table 2]. In four of these loci, several pedigree pairs provide duo-SGS evidence beyond genome-wide suggestive. The locus at 6q16.1 was previously identified as significant in single pedigree SGS in UT-571744, with risk variants in USP45 implicated[20]. Here, we find five pedigree pairs, all including UT-571744, and provide suggestive evidence, including one pair which achieves the second-highest duo-SGS significance in the study [μ(t) = 0.121, P = 7.8 × 10⁻⁸]. The 6q26 region achieves suggestive evidence in four pedigree pairs and harbors the PARK2 gene. At 5q21.3 four pedigree pairs show suggestive evidence and the locus contains the gene FBXL17. The locus at 7q11.23 is also supported by two genome-wide suggestive duo-SGS results. The remaining suggestive loci were supported by one pedigree pair: 1q42.2, 2p16.1, 3p25.2, 5q31.1, 12q24.31, 13q13.3, 18p11.22, 18q22.3 and 19p13.12. Genes in each of the duo-SGS regions are shown in Table 3.
Protein coding genes in duo-SGS regions by locus
| Locus | Gene name | Start | End |
|---|---|---|---|
| 1q42.2 | KCNK1 | 233,749,750 | 233,808,258 |
| 3p25.2 | TIMP4 | 12,194,551 | 12,200,851 |
| PPARG | 12,328,867 | 12,475,855 | |
| TSEN2 | 12,525,931 | 12,581,122 | |
| C3orf83 | 12,556,433 | 12,602,558 | |
| MKRN2 | 12,598,513 | 12,625,212 | |
| RAF1 | 12,625,100 | 12,705,725 | |
| TMEM40 | 12,775,024 | 12,810,956 | |
| CAND2 | 12,837,971 | 12,913,415 | |
| RPL32 | 12,875,984 | 12,883,087 | |
| IQSEC1 | 12,938,719 | 13,114,617 | |
| 5q21.3 | FBXL17 | 107,194,736 | 107,717,799 |
| 5q31.1 | C5orf15 | 133,291,201 | 133,304,478 |
| VDAC1 | 133,307,606 | 133,340,824 | |
| TCF7 | 133,450,402 | 133,487,556 | |
| SKP1 | 133,484,633 | 133,512,729 | |
| CTD-2410N18.5 | 133,502,861 | 133,561,762 | |
| PPP2CA | 133,530,025 | 133,561,833 | |
| CDKL3 | 133,541,305 | 133,706,738 | |
| 6q16.1 | POU3F2 | 99,282,580 | 99,286,660 |
| FBXL4 | 99,316,420 | 99,395,849 | |
| FAXC | 99,719,045 | 99,797,938 | |
| COQ3 | 99,817,276 | 99,842,080 | |
| PNISR | 99,845,927 | 99,873,207 | |
| USP45 | 99,880,190 | 99,969,604 | |
| CCNC | 99,990,256 | 100,016,849 | |
| PRDM13 | 100,054,606 | 100,063,454 | |
| 6q26 | PARK2 | 161,768,452 | 163,148,803 |
| 7q11.23 | CCL24 | 75,440,983 | 75,452,674 |
| RHBDD2 | 75,471,920 | 75,518,244 | |
| POR | 75,528,518 | 75,616,173 | |
| STYXL1 | 75,625,656 | 75,677,322 | |
| MDH2 | 75,677,369 | 75,696,826 | |
| SRRM3 | 75,831,216 | 75,916,605 | |
| HSPB1 | 75,931,861 | 75,933,612 | |
| YWHAG | 75,956,116 | 75,988,348 | |
| SRCRB4D | 76,018,651 | 76,039,012 | |
| ZP3 | 76,026,835 | 76,071,388 | |
| DTX2 | 76,090,993 | 76,135,312 | |
| UPK3B | 76,139,745 | 76,648,340 | |
| POMZP3 | 76,239,303 | 76,256,578 | |
| CCDC146 | 76,751,751 | 76,958,850 | |
| FGL2 | 76,822,688 | 76,829,143 | |
| GSAP | 76,940,068 | 77,045,717 | |
| 12q24.31 | HNF1A | 121,416,346 | 121,440,315 |
| C12orf43 | 121,440,225 | 121,454,305 | |
| OASL | 121,458,095 | 121,477,045 | |
| 13q13.3 | DCLK1 | 36,345,478 | 36,705,443 |
| 18p11.22 | RAB31 | 9,708,162 | 9,862,548 |
| 18q21.33 | CDH20 | 59,000,815 | 59,223,006 |
| 19p13.12 | CYP4F3 | 15,751,707 | 15,773,635 |
| CYP4F12 | 15,783,567 | 15,807,984 | |
| OR10H2 | 15,838,834 | 15,839,862 | |
| OR10H3 | 15,852,203 | 15,853,153 | |
| OR10H5 | 15,904,761 | 15,905,892 | |
| OR10H1 | 15,917,817 | 15,918,936 | |
| CYP4F2 | 15,988,833 | 16,008,930 | |
| CYP4F11 | 16,023,177 | 16,045,677 | |
| OR10H4 | 16,059,818 | 16,060,768 | |
| TPM4 | 16,177,831 | 16,213,813 |
Discussion
We expanded the shared genomic segment method to identify segregating chromosomal segments with overlapping statistical evidence from two HRPs. The strategy allows for genetic heterogeneity within each pedigree and provides formal significance thresholds for interpretation. The approach circumvents issues of intra-familial heterogeneity that can hinder mapping in large pedigrees. For complex diseases, large HRPs are likely enriched for multiple susceptibility variants[24] and sprinkled with sporadic cases; hence methods that require all cases to share to attain discovery power are not suitable. Here we optimize over subsets within pedigrees and consider pairing with all other pedigrees to provide the flexibility required. The method also specifically defines which pedigrees and cases share evidence at a locus, which is imperative for follow-up sequencing. Additional value may be gained by comparing demographic or clinical characteristics of the sharers in each pedigree to nuance the phenotype which may aid future gene mapping and provide insight into the nature of the mechanism of risk at a locus.
Application of the novel duo-SGS approach to eleven MM HRPs implicated a novel genome-wide significant region at 18q21.33 in MM risk, as well as 13 suggestive regions. Other than 6q16.1, which overlaps with our previous single pedigree SGS study, all loci identified in this study provide novel regions of interest in myeloma. None of the regions overlapped with existing genome-wide association study loci or other prior rare risk variants implicated in MM. A next step would be to investigate the loci for rare and deleterious coding variants or regulatory variants. Pedigree segregation methods can provide statistically compelling regions to concentrate efforts to identify and characterize regulatory risk variants. Also, SGS results can be used as genomic annotations of prior evidence to layer with additional omic information or provide a focused region for interrogating regulatory risk variants.
The literature supports a role of some of the genes found in our duo-SGS regions in MM. The genome-wide significant region at 18q21.33 contained CDH20, a gene that plays a role in intracellular adhesion by forming cadherin junctions. Cadherins have been suggested in solid tumor invasion, and metastasis as disruption to cell-cell junctions is a prerequisite[29]. Solid tumors co-aggregate in MM families suggesting a shared genetic background[10]. At 6q26, several pedigree pairs were genome-wide suggestive, and the overlapping segments fall in PARK2 which mediates proteasomal degradation. PARK2 is a tumor suppressor[30] and the gene harbors risk variants for lung cancer[31].
While the duo-SGS approach is useful for analyzing pedigrees smaller than those typically required for the single pedigree SGS approach, a large number of meioses are still required. The HRPs in this study are still substantially larger than those available in most family-based resources (8-23 meioses between sampled cases). Hence the method has practical limitations in other settings. Nonetheless, the interesting regions identified in large pedigrees provide evidence that can be used to narrow the search for risk variants in smaller families as well, as demonstrated in our prior study[20].
As in all family-based genetic studies, our results could be sensitive to inaccurate pedigree structures. However, relationship and ethnicity checks are standard protocols and mitigate the possibility of error. Another limitation to this study is the observational nature. Additional functional studies will be required to describe causation and characterize the mechanisms involved in these loci and myeloma risk.
We have identified several novel loci that segregate in at least two myeloma HRPs. These loci are likely to harbor genes and rare risk variants for MM and are compelling new targets for inherited risk to MM.
In conclusion, we developed a novel strategy for gene mapping in complex traits that uses multiple large high-risk pedigrees. The approach is robust to heterogeneity both within and between pedigrees and formally corrects for multiple testing to allow for statistically rigorous discovery. We applied this strategy to MM, a complex cancer of plasma cells, and identified one novel genome-wide significant locus at 18q21.33 and 13 suggestive loci. Our study offers a new technique for gene mapping and demonstrates its utility to narrow the search for risk variants in complex traits.
Declarations
AcknowledgmentsWe thank the participants and their families who make this research possible. Data collection was made possible, in part, by the Utah Population Database and the Utah Cancer Registry. Computations were supported by the University of Utah’s Center for High-Performance Computing.
Authors’ contributionsDesigned the study and wrote the manuscript: Waller RG, Camp NJ
Contributed to the duo-SGS method development: Waller RG, Madsen MJ, Gardner J, Camp NJ
Provided analysis support and edited the manuscript: Madsen MJ, Gardner J
Provided clinical support and reviewed the manuscript: Sborov DW
Generated figures and tables: Waller RG
Availability of data and materialsThe Shared Genome Segment (SGS) analysis software is freely available and can be accessed online: https://uofuhealth.utah.edu/huntsman/labs/camp/analysis-tool/shared-genomic-segment.php. Data used in the duo-SGS analysis includes pedigree structures, myeloma diagnoses, and genome-wide SNP genotypes. Pedigree structures necessary for these analyses were acquired from the Utah Population Database (UPDB). These are considered potentially identifiable by the Resource for Genetic and Epidemiologic Research (RGE) - the ethical oversight committee for the UPDB. As a result, access to these data requires review by the RGE committee (contact Jahn Barlow,
Research reported in this publication was supported by the National Cancer Institute of the National Institutes of Health under Award Number F99CA234943 and K00CA234943. The content is solely the responsibility of the authors and does not necessarily represent the official views of the National Institutes of Health. Methodological development of the duo-SGS method was supported by the University of Utah’s Center for Genomic Medicine. This research was supported by the Utah Cancer Registry, which is funded by the National Cancer Institute’s SEER Program, Contract No. HHSN261201800016I, the US Center for Disease Control and Prevention’s National Program of Cancer Registries, Cooperative Agreement No. NU58DP0063200, with additional support from the University of Utah and the Huntsman Cancer Foundation. Partial support for all datasets within the Utah Population Database is provided by the University of Utah, Huntsman Cancer Institute, and the Huntsman Cancer Institute Cancer Center Support grant, P30CA42014 from the National Cancer Institute.
Conflicts of interestAll authors declared that there are no conflicts of interest.
Ethical approval and consent to participateEthics committees at the University of Utah approved this research. All participants provided written informed consent.
Consent for publicationNot applicable.
Copyright© The Author(s) 2021.
REFERENCES
1. Sung H, Ferlay J, Siegel RL, et al. Global cancer statistics 2020: GLOBOCAN estimates of incidence and mortality worldwide for 36 cancers in 185 countries. CA Cancer J Clin 2021; doi: 10.3322/caac.21660.
2. Morgan GJ, Johnson DC, Weinhold N, et al. Inherited genetic susceptibility to multiple myeloma. Leukemia 2014;28:518-24.
3. Grosbois B, Jego P, Attal M, et al. Familial multiple myeloma: report of fifteen families. Br J Haematol 1999;105:768-70.
4. Hemminki K, Li X, Czene K. Familial risk of cancer: data for clinical counseling and cancer genetics. Int J Cancer 2004;108:109-14.
5. VanValkenburg ME, Pruitt GI, Brill IK, et al. Family history of hematologic malignancies and risk of multiple myeloma: differences by race and clinical features. Cancer Causes Control 2016;27:81-91.
6. Bourguet CC, Grufferman S, Delzell E, Delong ER, Cohen HJ. Multiple myeloma and family history of cancer a case-control study. Cancer 1985;56:2133-9.
7. Eriksson M, Hållberg B. Familial occurrence of hematologic malignancies and other diseases in multiple myeloma: a case-control study. Cancer Causes Control 1992;3:63-7.
8. Schinasi LH, Brown EE, Camp NJ, et al. Multiple myeloma and family history of lymphohaematopoietic cancers: Results from the International Multiple Myeloma Consortium. Br J Haematol 2016;175:87-101.
9. Landgren O, Linet MS, McMaster ML, Gridley G, Hemminki K, Goldin LR. Familial characteristics of autoimmune and hematologic disorders in 8,406 multiple myeloma patients: a population-based case-control study. Int J Cancer 2006;118:3095-8.
10. Kristinsson SY, Björkholm M, Goldin LR, et al. Patterns of hematologic malignancies and solid tumors among 37,838 first-degree relatives of 13,896 patients with multiple myeloma in Sweden. Int J Cancer 2009;125:2147-50.
11. Altieri A, Chen B, Bermejo JL, Castro F, Hemminki K. Familial risks and temporal incidence trends of multiple myeloma. Eur J Cancer 2006;42:1661-70.
12. Sud A, Kinnersley B, Houlston RS. Genome-wide association studies of cancer: current insights and future perspectives. Nat Rev Cancer 2017;17:692-704.
13. Mitchell JS, Li N, Weinhold N, et al. Genome-wide association study identifies multiple susceptibility loci for multiple myeloma. Nat Commun 2016;7:12050.
14. Weinhold N, Johnson DC, Chubb D, et al. The CCND1 c.870G>A polymorphism is a risk factor for t(11;14)(q13;q32) multiple myeloma. Nat Genet 2013;45:522-5.
15. Went M, Sud A, Försti A, et al; PRACTICAL consortium. Identification of multiple risk loci and regulatory mechanisms influencing susceptibility to multiple myeloma. Nat Commun 2018;9:3707.
16. Swaminathan B, Thorleifsson G, Jöud M, et al. Variants in ELL2 influencing immunoglobulin levels associate with multiple myeloma. Nat Commun 2015;6:7213.
17. Chubb D, Weinhold N, Broderick P, et al. Common variation at 3q26.2, 6p21.33, 17p11.2 and 22q13.1 influences multiple myeloma risk. Nat Genet 2013;45:1221-5.
18. Broderick P, Chubb D, Johnson DC, et al. Common variation at 3p22.1 and 7p15.3 influences multiple myeloma risk. Nat Genet 2011;44:58-61.
19. Halvarsson BM, Wihlborg AK, Ali M, et al. Direct evidence for a polygenic etiology in familial multiple myeloma. Blood Adv 2017;1:619-23.
20. Waller RG, Darlington TM, Wei X, et al. Novel pedigree analysis implicates DNA repair and chromatin remodeling in multiple myeloma risk. PLoS Genet 2018;14:e1007111.
21. Wei X, Calvo-Vidal MN, Chen S, et al. Germline Lysine-Specific Demethylase 1 (
22. Pertesi M, Vallée M, Wei X, et al. Exome sequencing identifies germline variants in DIS3 in familial multiple myeloma. Leukemia 2019;33:2324-30.
23. Thomas A, Camp NJ, Farnham JM, Allen-Brady K, Cannon-Albright LA. Shared genomic segment analysis. Mapping disease predisposition genes in extended pedigrees using SNP genotype assays. Ann Hum Genet 2008;72:279-87.
24. Knight S, Abo RP, Abel HJ, et al. Shared genomic segment analysis: the power to find rare disease variants. Ann Hum Genet 2012;76:500-9.
26. Lander E, Kruglyak L. Genetic dissection of complex traits: guidelines for interpreting and reporting linkage results. Nat Genet 1995;11:241-7.
27. Hanson HA, Leiser CL, Madsen MJ, et al. Family Study Designs Informed by Tumor Heterogeneity and Multi-Cancer Pleiotropies: The Power of the Utah Population Database. Cancer Epidemiol Biomarkers Prev 2020;29:807-15.
28. Purcell S, Neale B, Todd-Brown K, et al. PLINK: a tool set for whole-genome association and population-based linkage analyses. Am J Hum Genet 2007;81:559-75.
29. Jeanes A, Gottardi CJ, Yap AS. Cadherins and cancer: how does cadherin dysfunction promote tumor progression? Oncogene 2008;27:6920-9.
30. Xu L, Lin DC, Yin D, Koeffler HP. An emerging role of PARK2 in cancer. J Mol Med (Berl) 2014;92:31-42.
Cite This Article
Export citation file: BibTeX | RIS
OAE Style
Waller RG, Madsen MJ, Gardner J, Sborov DW, Camp NJ. Duo Shared Genomic Segment analysis identifies a genome-wide significant risk locus at 18q21.33 in myeloma pedigrees. J Transl Genet Genom 2021;5:112-23. http://dx.doi.org/10.20517/jtgg.2021.09
AMA Style
Waller RG, Madsen MJ, Gardner J, Sborov DW, Camp NJ. Duo Shared Genomic Segment analysis identifies a genome-wide significant risk locus at 18q21.33 in myeloma pedigrees. Journal of Translational Genetics and Genomics. 2021; 5(2): 112-23. http://dx.doi.org/10.20517/jtgg.2021.09
Chicago/Turabian Style
Waller, Rosalie Griffin, Michael J. Madsen, John Gardner, Douglas W. Sborov, Nicola J. Camp. 2021. "Duo Shared Genomic Segment analysis identifies a genome-wide significant risk locus at 18q21.33 in myeloma pedigrees" Journal of Translational Genetics and Genomics. 5, no.2: 112-23. http://dx.doi.org/10.20517/jtgg.2021.09
ACS Style
Waller, RG.; Madsen MJ.; Gardner J.; Sborov DW.; Camp NJ. Duo Shared Genomic Segment analysis identifies a genome-wide significant risk locus at 18q21.33 in myeloma pedigrees. J. Transl. Genet. Genom. 2021, 5, 112-23. http://dx.doi.org/10.20517/jtgg.2021.09
About This Article
Special Issue
Copyright

Data & Comments
Data
0

 Cite This Article 5 clicks

 Like This Article 16
likes
Like This Article 16
likes


Comments
Comments must be written in English. Spam, offensive content, impersonation, and private information will not be permitted. If any comment is reported and identified as inappropriate content by OAE staff, the comment will be removed without notice. If you have any queries or need any help, please contact us at support@oaepublish.com.