
In vitro modeling of the complex retinal condition age-related macular degeneration

Abstract
Aim: To model a complex retinal disease such as age-related macular degeneration (AMD) in vitro, we aimed to combine genetic and environmental risk factors in a retinal pigment epithelium (RPE) cell culture model generated via induced pluripotent stem cells (iPSCs) from subjects with an extremely high and an extremely low genetic disease risk. As an external stimulus, we chose defined oxidative stress conditions.
Methods: Patients were genotyped for known AMD-associated genetic variants and their individual genetic risk score (GRS) was calculated defining individual iPSC-RPE cell lines which reflect the extreme ends of the genetic risk for AMD. Sodium iodate (NaIO3, SI) was used to induce oxidative stress and cellular responses were followed by analyzing nuclear factor erythroid 2-related factor 2 (NRF2) pathway activation by mRNA and protein expression.
Results: We present a collection of eight iPSC-RPE cell lines, with four each harboring an extreme low or an extreme high GRS for AMD. RPE identity was verified structurally and functionally. We found that 24 and 72 h of SI treatment induced a significant upregulation of NRF2 response genes HMOX1 and NQO1, without showing cytotoxic effects or negatively influencing RPE cell integrity. High- vs. low-risk cell lines revealed similar first line defenses in oxidative stress response mediated through the NRF2 pathway.
Conclusion: Delineating the NRF2-mediated oxidative stress response was sought in iPSC-RPE cell lines with maximally divergent genetic AMD risk profiles. Under the specific stress conditions chosen, our data indicate that genetic predisposition to AMD may not exert a major influence on the NRF2 signaling pathway.
Keywords
INTRODUCTION
Age-related macular degeneration (AMD) is a degenerative disease of the central retina and is the leading cause of vision loss in developed countries[1], with prevalence rates in European individuals ≥ 70 years of age as high as 13.2% for early AMD and 3.0% for the late forms[2]. The molecular mechanisms underlying AMD pathology are not fully understood, in part due to its nature as a complex disease entity where an individual risk to develop AMD is determined by a unique combination of genetic as well as environmental risk factors[3,4]. Our understanding of AMD genetics has greatly benefitted from large genome wide association studies, the latest of which identified 52 single nucleotide polymorphisms (SNPs) at 34 independent loci to be significantly associated with the late-stage form of AMD[5]. Environmental risk factors for AMD include aging, cigarette smoking, sunlight exposure, hypertension, cardiovascular disease, and diet, although some of these data are still controversial[6].
Almost all of the environmental risk factors for AMD considered so far have an underlying theme in common that points to increased oxidative stress as an important trigger of disease pathology (reviewed in[7-9]). A particularly high oxidative stress burden can be observed in the retinal pigment epithelium (RPE), the retinal cell layer between the choriocapillaris and the layer of cone and rod photoreceptor cells, thought to represent the primary site of AMD pathology[10]. Specifically, oxidative stress in the RPE results from an exceptionally high metabolic rate of this tissue, an oxygen tension between the retina and the oxygen-rich choriocapillaris, photooxidative stress caused by intense light exposure, and a continuous phagocytosis of shed photoreceptor outer segments (POS)[9,11-13].
To cope with an unfavorable oxidative stress condition, RPE cells use an efficient machinery to neutralize reactive oxygen species (ROS). One pathway playing a crucial role in the defense system is the route via nuclear factor erythroid 2-related factor 2 (NRF2). In its function as a transcription factor, activated NRF2 binds to antioxidant response elements (ARE) to initiate transcription of target genes such as heme oxygenase 1 (HMOX1) and NAD(P)H dehydrogenase (quinone) 1 (NQO1)[9,14-17]. In healthy RPE cells, the NRF2 signaling pathway is responsible for neutralizing oxidative stress and preserving cellular redox homeostasis[9,18]. For example, in ARPE-19, a widely used cell line with a number of features characteristic of RPE cells, cigarette smoke extracts increase the NRF2 signaling response and lead to complement activation[16]. Further, Nrf2 deficiency increases the complement response, which suggests that Nrf2 is not only involved in oxidative damage but, in absentia, also promotes a pro-inflammatory environment[16]. Of note, Nrf2-deficient mice develop age-related retinal pathology similar to an AMD-like degeneration of the RPE, thickening of Bruch’s membrane, development of drusen, lipofuscin accumulation, and inflammatory protein deposition in the sub-RPE area[19].
To gain a better understanding of the molecular pathology of AMD and the contribution of oxidative stress responses to disease-associated changes, we aimed to generate a cellular model which allows us to combine genetic and environmental risk factors in an in vitro cell culture system. To reflect the individual genetic risk for developing AMD, we applied a genetic risk score (GRS) based on a minimal set of selected risk variants from eight gene loci associated with AMD at genome-wide significance[20]. This allowed us to discriminate iPSC-RPE cell lines in those with very high and those with very low genetic risk for AMD. Oxidative stress was induced by treating the cell lines with sodium iodate (SI), a potent stressor of RPE cells[21,22]. By comparing cell lines of the two extreme ends of the genetic risk spectrum in defined experimental settings, we aimed to sort out the genetic influence of NRF2-mediated stress response in AMD pathogenesis.
METHODS
Genotyping and GRS calculation
Patients were recruited at the Eye Clinic of the University Hospital Regensburg and clinically examined by an experienced ophthalmologist (Brandl C). AMD phenotyping was performed in a clinical routine setting via gold standard multimodal imaging. This included funduscopy and color fundus imaging (FF450 plus fundus camera, Zeiss, Oberkochen, Germany), macular optical coherence tomography, fundus autofluorescence, and fluorescein angiography (all Spectralis, Heidelberg Engineering, Heidelberg, Germany). Patients were assessed for the presence or absence of features of early AMD, such as drusen and/or hyper/hypopigmentation, or signs of late-stage disease such as geographic atrophy or neovascular manifestations, the latter characterized by sub/intra-retinal fluid, leakage of choroidal neovascularization, and bleeding. Using Sanger sequencing or restriction fragment length polymorphisms, all probands were genotyped for 13 selected AMD-associated SNPs at eight different loci known to be highly correlated with AMD risk. Individual GRSs were calculated using the model reported by Grassmann et al.[20], 2012.
Generation of iPSCs and differentiation into RPE
Based on the established GRS, blood samples or skin biopsies were again collected from high-risk (HR) and low-risk (LR) probands, fibroblast cultures or peripheral blood mononuclear cells (PBMCs) were established, reprogrammed to induced pluripotent stem cells (iPSCs), and subsequently differentiated into iPSC-RPE as described[23-25]. Pigmented cell clusters were picked from six-well plates and sub-cultured followed by cryopreservation in liquid nitrogen. Prior to experimental analysis, iPSC-RPE cells were thawed, seeded on six-well plates coated with Matrigel® GFR (Corning Inc., Corning, NY, USA), passaged once after two weeks, and cultivated for another two weeks before seeding the cells onto Transwell filters (ThinCert® Cell Culture Inserts by Greiner Bio-One, Kremsmünster, Austria) in a 6- or 12-well format. Unless stated otherwise, cells were matured on Transwell inserts for sux weeks and used in experiments during weeks 6-8. The culture medium was replaced every 72 h.
Verification of RPE cell characteristics
Immunocytochemistry
For immunocytochemistry, a section of the Transwell filter was excised and transferred into 1× PBS. After fixation of the cells with 2% PFA for 10 min followed by three washing steps for 5 min with 1× PBS, the filters were blocked in 10% normal goat serum, 0.3% Triton X-100 in PBS. After 30 min of incubation at room temperature (RT), the blocking solution was replaced by the primary antibody solution and incubated at 4 °C overnight (ON). After three washing steps with PBS, cells were incubated in secondary antibody for 1 h at RT, washed again, and mounted onto microscope slides using Dako Fluorescence Mounting Medium (Agilent Technologies, Santa Clara, USA). Antibodies used for immunochemistry were rabbit polyclonal anti-hBEST1-334 (targeting amino acids 572-585 of the human BEST1 protein) (diluted 1:250)[26] and rabbit polyclonal anti-ZO-1 (Thermo Fisher Scientific, Waltham, USA) (diluted 1:500). Secondary antibodies for immunofluorescence were goat Alexa 594-conjugated anti-rabbit and Alexa 488-conjugated anti-mouse (dilution 1:1000, Thermo Fisher Scientific). All filters were counterstained with DAPI for visualization of cell nuclei.
Microscopy images of BEST1 and ZO-1 stainings were taken on an Olympus FV3000 confocal microscope and processed with the FV31S-SWPMS software set. The 40× magnification images of SI treated cells were visualized using a Fluorescence Microscope Axioskop 2 (Carl Zeiss GmbH, Jena, Germany). Image editing was done in ImageJ 1.52n.
Photoreceptor outer segment phagocytosis assay
In short, POS were isolated from porcine retinae by sucrose density gradient centrifugation as described[23] and their concentration was determined applying the Roti®-Quant Bradford reagent (Carl Roth, Karlsruhe, Germany). A POS concentration of 4 μg/cm2 for analysis of POS phagocytosis in RPE cells served as point of reference[12,27], which is in accordance with the typical number of 20 POS per hiPSC-RPE cell[4,23,24]. POS were diluted in Opti-MEM® (Thermo Fisher Scientific) with 1% Pen/Strep and fed to iPSC-RPE cultured in a 12-well format for 2 h. Subsequently, excess POS were removed with PBS and the cells were covered with fresh maintenance medium. Samples for subsequent Western blot analyses were taken after the 2 h feeding time point (0 h of degradation, confirming successful internalization of POS) and after 4 and 6 h in total (revealing POS degradation 2 and 4 h after the feeding was stopped). Samples for Western blots were harvested in 1× PBS + complete™ protease inhibitor (Sigma Aldrich, St. Louis, MO, USA), sonicated at 30% intensity for 10 s, mixed with Laemmli buffer, and heated to 95 °C for 5 min.
Western blotting
Proteins were separated by sodium dodecyl sulfate - polyacrylamide gel electrophoresis in 12.5% gels and then transferred to polyvinylidene difluoride membranes (Immobilon, Millipore, Schwalbach, Germany) by semidry blotting (24 V, 40 min). Membranes were blocked in TBST (Tris-buffered saline: 20 mM Tris,
Quantitative reverse transcriptase polymerase chain reaction
RNA isolation was done applying the PureLink® RNA Mini Kit (Thermo Fisher Scientific) according to the manufacturer’s protocol with only minor changes. In brief, for homogenization, samples were transferred onto QIAshredder homogenizers (Qiagen, Hilden, Germany) and centrifuged for 3 min at 12,000 g. Lysed samples were subjected to Steps 1-5 of the manufacturer’s protocol. In Step 6, 350 µL Wash Buffer I was added to the spin cartridges and centrifuged at 12,000 g for 30 s, followed by a 15 min DNAse digestion with 80 µL DNAse diluted 1:8 in Buffer RDD, before columns were washed with 350 µL of Wash Buffer I. RNA was eluted in 30 µL of RNAse-free water and concentrations were measured on the NanoDrop® ND1000 Spectrophotometer. Then, 500 ng of RNA were transcribed into cDNA with RevertAid M-MuLV Reverse Transcriptase (Thermo Fisher Scientific) and poly(dT) primers according to the manufacturer’s instructions. Reaction mixtures for quantitative reverse transcriptase polymerase chain reaction (qRT-PCR) amplifications contained Takyon™ ROX Probe 2X MasterMix dTTP (Eurogentec, Seraing, Belgium),
Measurement of transepithelial electrical resistance
After six weeks of cultivation on Transwell inserts, transepithelial electrical resistance (TEER) of iPSC-RPE was measured with an epithelial Volt/Ohm Meter (World Precision Instruments, Sarasota, FL, USA) according to the manufacturer’s instructions. In preparation for the measurements, the electrodes were sterilized in 70% ethanol for 15 min and then immersed in a 150 mM NaCI solution for 15 min to allow equilibration. Blank measurements were taken from Matrigel® coated Transwell filters which did not contain any cells. After deducting the mean of the blank values from the resistance measurements, cell specific resistance values were multiplied with the surface area of the Transwell filter to obtain values in Ω*cm2.
Enzyme-linked immunosorbent assay
Secreted VEGFA protein in apical and basal supernatants of iPSC-RPE cells cultured on Transwell inserts for six weeks was analyzed applying the Human vascular endothelial growth factor (VEGF) Quantikine Enzyme-linked immunosorbent assay Kit (R&D System, Minneapolis, MI, USA) according to the manufacturer’s instructions. Supernatants were diluted 1:10 in PBS prior to analysis.
Oxidative stress induction
SI-mediated oxidative stress treatment
SI was dissolved in iPSC-RPE maintenance medium without KOSR (KnockOut™ Serum Replacement, Thermo Fisher Scientific) and diluted to the desired concentration. After evaluating cytotoxicity of SI on iPSC-RPE, a concentration of 0.5 mM SI was chosen for the 24 h stress experiments. For an extended duration stress model, cells were exposed to concentrations of 0.125 and 0.25 mM SI over a period of 72 h and the media was replaced daily. In both experimental settings, cells cultivated in iPSC-RPE maintenance medium without KOSR served as controls.
Cytotoxicity assay (LDH Release Assay)
To determine if SI treatment was cytotoxic to iPSC-RPE, cells were seeded on 96-well plates, matured for four weeks, and then subjected to oxidative stress treatment. SI-induced cytotoxicity was measured applying the CytoTox 96® Non-Radioactive Cytotoxicity Assay (Promega, Madison, WI, USA) according to the manufacturer’s instructions. Absorbance measurements were performed with a TECAN SPARK® Multimode Microplate Reader (TECAN, Männedorf, Switzerland) at 490 nm with a reference wavelength of 620 nm.
Statistical evaluation
Statistical analysis was performed with R (version 3.6.0)[29]. Gaussian distribution was determined by a Shapiro-Wilk normality test. These data were analyzed with the Student’s t-test (2 experimental groups) or the ANOVA test with Tukey’s multiple comparison test (> 2 experimental groups). Data not following a Gaussian distribution were analyzed with the Mann-Whitney U-test (2 experimental groups) or Kruskal-Wallis test with post hoc Dunn’s multiple comparison test following the Benjamini-Hochberg method implemented in the Fisheries Stock Analysis package[30] (> 2 experimental groups).
RESULTS
Recruitment of probands and generation of an iPSC-RPE repository
To investigate the molecular mechanisms contributing to AMD disease, our aim was to generate iPSC-RPE cell lines from donors with both a very low and a very high genetic risk for the disease. We included 161 patients recruited at the Eye Clinic of the University Hospital Regensburg, Germany. Of these, 77 were categorized as having early (AREDS grades 1-4; n = 16) or late stage [mostly neovascular (NV); n = 61] AMD. Seventy-four individuals were free of any signs of early or late AMD pathology and served as controls. The probands were genotyped for 13 SNPs at 8 chromosomal loci known to be sufficient to calculate an individual AMD-associated GRS[5,31] [Table 1].
Characteristics of chromosomal loci used for genotyping and AMD-associated GRS calculations
| ID | Locus | SNP | Impact/effect of variant | Odds ratio | Non risk allele | Risk allele |
| 1 | CFH | rs1061170 | p.Y402H | 2.74 | T | C |
| 2 | rs800292 | p.I62V | 2.43 | A | G | |
| 3 | rs6677604 | Proxy for ∆CFHR3/CFHR1 | 2.19 | A | G | |
| 4 | ARMS2/HTRA1 | rs10490924 | p.A69S | 3.13 | G | T |
| 5 | CFB | rs4151667 | p.L9H | 2.82 | A | T |
| 6 | rs438999 | proxy for rs641153 (p.R32Q) | 2.31 | C | T | |
| 7 | C3 | rs2230199 | p.R102G | 1.52 | G | C |
| 8 | APOE | rs7412 | p.R158C | 1.41 | C | T |
| 9 | rs429358 | p.C112R | 1.35 | C | T | |
| 10 | PLA2G12A | rs2285714 | Synonymous exonic, unknown | 1.14 | C | T |
| 11 | LIPC | rs493258 | Intergenic (36 kb upstream) | 1.18 | T | C |
| 12 | rs10468017 | Intergenic (46 kb upstream) | 1.26 | T | C | |
| 13 | TIMP3 | rs9621532 | Intronic, unknown | 1.58 | C | A |
The genetic AMD risk profiles were calculated applying the model reported by Grassmann et al.[20] (2012). According to this model, a risk score in Category 1 represents a very low genetic risk for AMD, whereas a risk score in Category 5 confers a very high genetic AMD risk. Study participants were normally distributed over the five risk categories, with the majority classifying as Categories 2-4. Only 10% of the participants were assigned to the extreme GRS Categories 1 and 5 [Figure 1A]. When participants were categorized in AMD patients and asymptomatic controls a shift in the distribution over the risk categories becomes evident [Figure 1B].
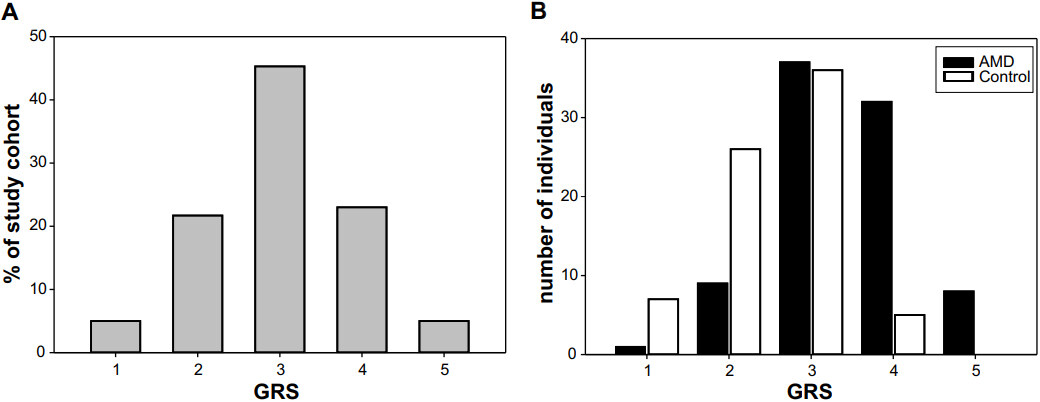
Figure 1. GRS distribution in the AMD study cohort. (A) GRS of the 161 study probands showed a normal Gauss distribution when summarized for all individuals regardless of AMD phenotype. (B) Categorizing the participants in AMD cases and asymptomatic controls revealed only one individual with AMD in Category 1, whereas no asymptomatic controls were found in high-risk GRS Category 5. AMD: Age-related macular degeneration; GRS: genetic risk score.
As we wanted to generate an iPSC-RPE repository that would allow us to perform experiments in cell lines with maximally different genetic risks for AMD, four probands from Category 1 (LR) who showed no AMD phenotype and four persons from Category 5, all with late stage NV-AMD (HR) [Table 2], were selected as donors for the subsequent generation of iPSC-RPE cells. PBMCs or fibroblasts were used to reprogram the cells to iPSCs and subsequently differentiate them into iPSC-RPE. We did not observe any differences in iPSC-RPE originating from fibroblasts or PBMCs with regard to their cell characteristics. Information on the donors of the biomaterials is given in Table 2. Male and female individuals were included in both risk groups and the mean age of HR donors was 64.8 years (± 1.8 years), whereas the LR donors were slightly older with a mean age of 80 years (± 8.3 years). GRS of all donors are given in Table 2 traceable via SNP IDs shown in Table 1. While the HR donors are assigned to GRS Category 5 and the LR donors to GRS Category 1, there are still some differences in individual genotypes within the HR and LR cell lines. For example, donor HR3 is homozygous for 11 out of 13 AMD-risk altering alleles, whereas donor LR3 is homozygous for only three of the AMD-associated SNPs, clearly showing the genetic differences between the HR and LR cell lines. Specifically, all high-risk individuals were homozygous for CHF p.Y402H and ARMS2 p.A69S, while the low-risk individuals harbored no risk altering variant at these two loci.
Characteristics of iPSC-RPE lines generated
| Cell line | Source | Gender | YOB | AMD status | Affected eye | Homozygosity for risk allele of SNP ID# | Heterozygosity for risk allele SNP ID# |
| HR1 | Fibroblast | M | 1947 | CNV | L | 1, 2, 3, 4, 5, 6, 9, 10, 12, 13 | 11 |
| HR2 | PBMC | F | 1950 | CNV | L/R | 1, 2, 3, 4, 5, 6, 7, 8, 9, 10, 13 | 11, 12 |
| HR3 | PBMC | F | 1950 | CNV | L/R | 1, 2, 3, 4, 5, 6, 9, 10, 11, 12, 13 | |
| HR4 | Fibroblast | F | 1946 | CNV | L/R | 1, 2, 3, 4, 5, 6, 9, 10, 12, 13 | 11 |
| LR1 | PBMC | M | 1924 | Control | - | 5, 6, 9, 13 | 2, 3, 11, 12 |
| LR2 | PBMC | M | 1946 | Control | - | 3, 6, 9, 10, 13 | 2, 5, 8, 12 |
| LR3 | PBMC | F | 1933 | Control | - | 2, 9, 13 | 3, 5, 6, 10, 12 |
| LR4 | Fibroblast | F | 1928 | Control | - | 3, 5, 9, 10, 13 | 2, 6, 12 |
Prior to analysis, iPSC-RPE from HR and LR donors were matured on Transwell inserts for a duration of six weeks and the discrete TEER was measured at weekly intervals. TEER values increased until week 2 and then remained constant over the course of time, with a mean value including all cell lines reaching
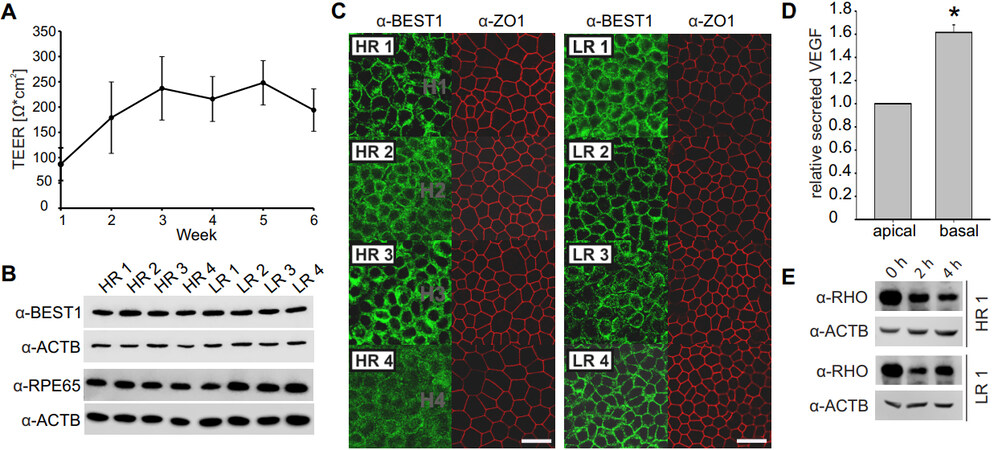
Figure 2. Characterization of iPSC-RPE cells. *Indicates statistically significant differences < 0.05, Mann-Whitney U-test. (A) TEER was measured once a week while iPSC-RPE cells were matured on Transwell inserts and reached a stable plateau after week 2. Data were pooled from all cell lines. (B) Protein expression of RPE-specific markers BEST1 and RPE65 was assessed by Western blot and was uniform in all cell lines. ACTB served as a loading control. (C) iPSC-RPE morphology was assessed by immunocytochemistry with anti-BEST1 and anti-ZO-1 antibodies (scale bar: 20 µm). (D) VEGF secretion into the apical and basal compartment of the Transwell inserts was measured by ELISA and pooled data from all cell lines show a polar secretion of VEGF with higher protein amounts found in the basal compartment. (E) POS phagocytosis was followed by an uptake and degradation assay. Successful uptake of POS by iPSC-RPE cells is indicated by prominent rhodopsin (RHO) staining (37 kDa) at 0 h of degradation while efficient protein degradation can be seen after 2 and 4 h. ACTB served as a loading control. iPSC: Induced pluripotent stem cell; TEER: transepithelial electrical resistance; RPE: retinal pigment epithelium; VEGF: vascular endothelial growth factor; POS: photoreceptor outer segments; ELISA: enzyme-linked immunosorbent assay.
Establishing an oxidative stress model to mimic environmental risk factors in vitro
One of our aims is to delineate molecular processes differentiating between HR and LR iPSC-RPE lines. In a first step, we tested expression of complement genes CFH and C3 as well as NRF2 signaling response genes HMOX1 and NQO1. Data from four individual batches of cells cultured independently (with three technical replicates per batch) were included. Data from qRT-PCR were normalized against HPRT1 expression and calibrated against the mean of all low-risk cell lines. The results reveal no significant differences, which in part could be due to a high variability in baseline expression between the individual cell lines [Figure 3A].
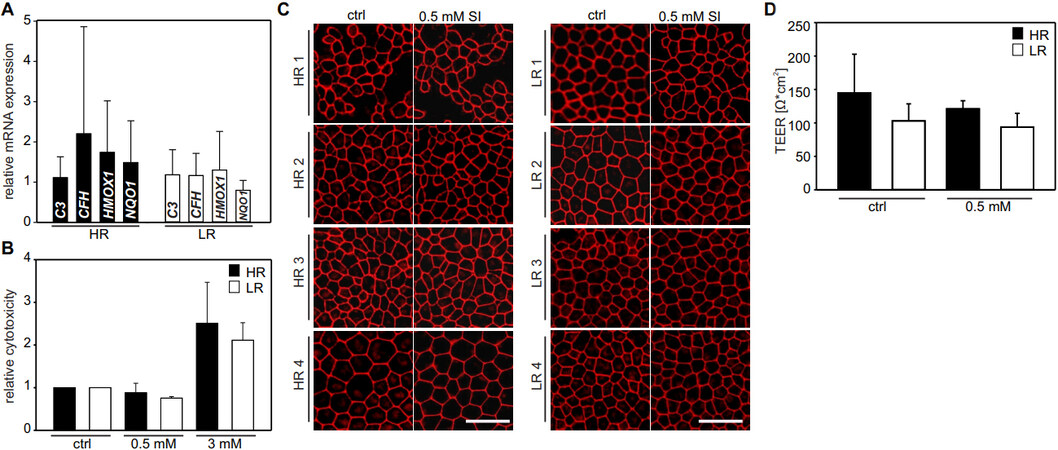
Figure 3. Establishing an SI-induced oxidative stress model. (A) Baseline mRNA expression of complement genes CFH and C3 as well as NRF2 response genes HMOX1 and NQO1 were analyzed by quantitative reverse transcriptase polymerase chain reaction and data from four independent batches of cells (with three technical replicates per batch) were pooled. Data were normalized against HPRT1 expression and calibrated against the mean of all LR cell lines (n = 4). (B) iPSC-RPE cultured in 96-well plates for four weeks were subjected to 24 h treatment with 0.5 or 3 mM SI. Relative cytotoxicity in relation to untreated cells was determined using an LDH release assay and was not increased upon treatment with
To establish an oxidative stress model, we next used SI as a chemical stressor and determined a concentration of 0.5 mM and a treatment duration of 24 h suitable for stressing the cells without inducing significant changes in cell viability (data not shown). A cytotoxicity assay demonstrated that 24 h treatment with 0.5 mM SI did not induce cytotoxicity in HR or LR cell lines, while at a concentration of 3 mM treatment an increased relative cytotoxicity was observed in all cell lines tested [Figure 3B]. To further confirm that SI treatment did not affect RPE integrity, SI treated cells were stained for ZO-1. iPSC-RPE morphology and tight junction cell-cell contacts remained unaffected at 24 h of oxidative stress in any of the cell lines [Figure 3C]. In addition, we measured TEER revealing no unwanted effects of SI on the overall integrity of the cells. TEER values were slightly lower in SI treated cells, but the difference to untreated cells did not reach statistical significance and there was no difference between HR and LR cell lines (Mann-Whitney U-test, P > 0.05) [Figure 3D]. In summary, an acute oxidative stress model was established where iPSC-RPE cells are only mildly stressed without triggering measurable effects on cellular integrity.
NRF2-mediated oxidative stress response upon acute SI treatment for 24 h
Next, we analyzed the influence of acute oxidative stress on NRF2-mediated stress response by qRT-PCR analysis of downstream target genes HMOX1 and NQO1. Upon SI treatment, transcription of both genes was significantly upregulated in all cell lines when compared to controls (cells incubated for 24 h maintenance medium without KOSR). HMOX1 expression was upregulated about two-fold, whereas NQO1 expression increased up to 10-16-fold (Mann-Whitney U-test, P < 0.005) [Figure 4A and B, left].
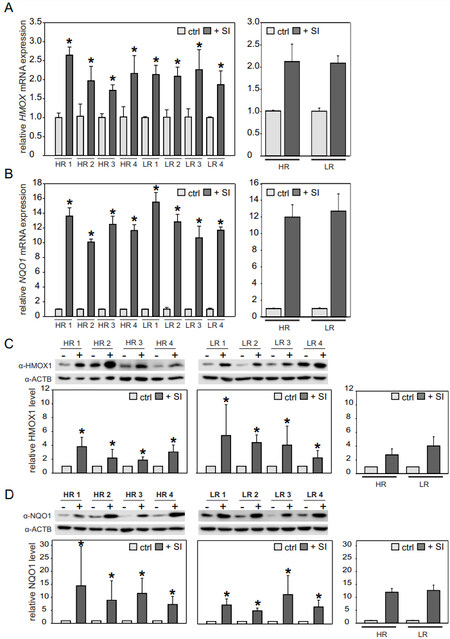
Figure 4. SI-mediated oxidative stress in iPSC-RPE cells after 24 h treatment. iPSC-RPE cells were treated with 0.5 mM SI for 24 h, while controls were maintained without SI. mRNA expression of HMOX1 (A) and NQO1 (B) was normalized to HPRT1 and calibrated against the control (ctrl). While SI treatment significantly upregulated NQO1 and HMOX1 expression in all cell lines, no differences in the NRF2-mediated stress response was observed between HR and LR lines. Western blot analysis confirmed the mRNA results. Signal intensities were normalized to ACTB expression and calibrated against the untreated control. Data are presented as mean + SD [n = 3 for (A, B) and n = 6 for (C, D)]. The left panels show individual cell lines, while comparisons between HR and LR (n = 4; *P < 0.05, Mann-Whitney U-test) are presented in the graphs to the right. SI: Sodium iodate; iPSC: induced pluripotent stem cell; RPE: retinal pigment epithelium; HR: high-risk; LR: low-risk.
There was no significant difference in HMOX1 and NQO1 expression between HR and LR iPSC-RPE cells (Mann-Whitney U-test, P > 0.05) [Figure 4A and B, right]. Changes in mRNA expression were verified by Western blot analysis with antibodies against HMOX1 and NQO1. As visualized in HMOX1 (28 kDa) and NQO1 (29 kDa) immunostainings, cells incubated with 0.5 mM SI exhibited more intense staining than controls. Densitometric quantification of signals from six replicates showed that HMOX1 as well as NQO1 protein expression was significantly increased in SI-treated cells compared to untreated controls. It is also evident that HMOX1 protein expression is less prominent (2-5-fold) when compared to NQO1 protein expression (5-14-fold) (Mann-Whitney U-test, P < 0.05) [Figure 4C and D, left], supporting the mRNA results [Figure 4A and B]. Again, quantification of HMOX1 and NOQ1 protein expression revealed no differences between HR and LR iPSC-RPE cells (Mann-Whitney U-test, P > 0.05) [Figure 4C and D, right].
NRF2-mediated oxidative stress response upon extended SI treatment for 72 h
We finally extended the oxidative stress model to reflect a more long-term stress situation. HR and LR iPSC-RPE were treated with SI for a duration of 72 h, with the culture medium being renewed daily to keep the SI concentrations consistent over time. Concentrations of 0.125 and 0.25 mM were chosen for these experiments based on findings in preliminary tests (data not shown). Initially, we confirmed that both SI concentrations had no negative effect on iPSC-RPE cytotoxicity [Supplementary Figure 2A], stable TEER values [Supplementary Figure 2B], and monolayer integrity and intact cobblestone morphology, as indicated by uniform ZO-1 staining [Supplementary Figure 2C]. Relative cytotoxicity of the SI treatments was not increased in comparison to control, but it was increased when cells were treated with 1.5 mM SI for 72 h [Supplementary Figure 2A]. Treatment with SI resulted in a dose-dependent upregulation of HMOX1 expression, with statistical significance being reached for the 0.25 mM treatment in all cell lines (Kruskal-Wallis test with post hoc Dunn’s multiple comparison test using Benjamini-Hochberg method, P < 0.01) [Figure 5A].
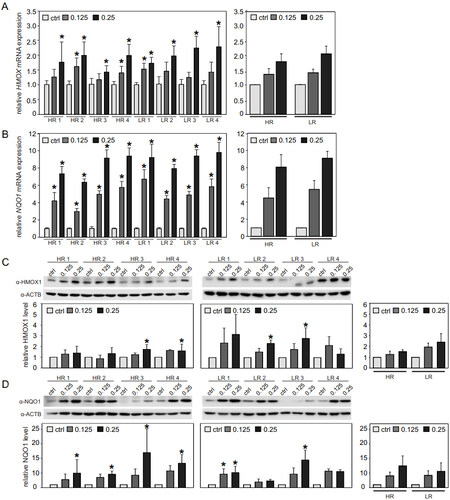
Figure 5. SI-mediated oxidative stress in iPSC-RPE after 72 h treatment. iPSC-RPE cell lines were treated daily with fresh 0.125 or
When data were analyzed with regard to differences between HR and LR cell lines, the dose-dependent effect was clearly visible in both groups, although cell lines with differing AMD-associated GRS failed to show differences in HMOX1 expression after treatment with either of the concentrations (Mann-Whitney U-test, P > 0.05) [Figure 5A]. In line with the results from the 24 h treatment, NQO1 expression was impacted more strongly by 72 h SI treatment than HMOX1 expression. NQO1 expression also increased dose dependently and reached values of 3-10-fold upregulation, showing statistically significant differences between control and SI treatment for both concentrations in all cell lines (Kruskal-Wallis test with post hoc Dunn’s multiple comparison test using Benjamini-Hochberg method, P < 0.05 for comparison control vs. 0.125 mM SI, P < 5 × 10⁻⁵ for comparison control vs. 0.25 mM SI). Concordant with data on HMOX1 expression, NOQ1 expression upon oxidative stress treatment was not differentially expressed in HR and LR cell lines (Mann-Whitney U-test, P > 0.05) [Figure 5B]. The qRT-PCR results were confirmed by Western blot analysis and a SI dose-dependent increase in HMOX1 and NOQ1 expression was observed at 72 h of SI treatment compared to control. After densitometric evaluation of Western blot signal intensities, the observed differences failed to reach statistical significance in all cell lines (Kruskal-Wallis test with post hoc Dunn’s multiple comparison test using Benjamini-Hochberg method, P < 0.05), even though a clear SI dose-dependent trend in increased HMOX1 and NQO1 protein was notable in the Western blot images as well as the quantifications. No differences were found when comparing oxidative stress induced protein amounts of HMOX1 and NQO1 between HR and LR cell lines (Mann-Whitney U-test, P > 0.05) [Figure 5C and D].
Taken together, oxidative stress was robustly induced in an acute 24 h setting and an extended duration situation using lower SI concentrations for 72 h. NRF2 downstream response genes HMOX1 and NQO1 were upregulated under the two conditions chosen, although in no situation a genetic influence in HR and LR AMD iPSC-RPE lines was apparent. This led us to conclude that the genetic risk to develop AMD has no measurable effect on influencing the NRF2-associated first-line oxidative stress defense.
DISCUSSION
Our aim was to establish a cellular model system which allows us to combine both genetic and environmental risk factors in vitro crucial to elucidate the individual contributions to AMD pathogenesis. Consequently, we selected our study participants based on their genetic risk profile for AMD rather than on their AMD phenotype alone, resulting in four CNV patients with a very high GRS for AMD and four individuals with a very low GRS who had no AMD phenotype. Patient-derived iPSC-RPE cells were generated from these individuals and characterized for RPE integrity before they were subjected to analysis on NRF2-mediated oxidative stress response mechanisms. We established a short term, acute stress model in which cells were treated with SI for 24 h as well as an intermediate stress duration model of 72 h SI treatment. While significant upregulation of NRF2 pathway response genes was established under all experimental conditions, there was no difference in stress reaction between HR and LR cell lines. This led us to suggest that NRF2-dependent oxidative stress response following artificial stress induction by application of SI in RPE cells is not dependent to a measurable extent on genetic AMD susceptibility.
Monogenetic disorders are commonly caused by variants in a few genes while the causal variants usually display strong effects on the phenotypic expression. This makes it rather straightforward to model phenotypic effects in vitro. In contrast, complex diseases, such as AMD, are defined by a multifaceted genetic repertoire composed of several genetic variants that individually only display weak effects on a trait or phenotype. Additionally, it is mostly unknown how and to what extent environmental factors interact with the given genetic predisposition. Not surprisingly, such a situation is inherently difficult to model. Various animal models and cell model systems have been implemented to study AMD pathogenesis, although they all have limitations and none of them fully mimics the complexity of AMD, specifically regarding the elaborate genetic profile of susceptibility to disease[32-34]. Since the RPE is central to AMD pathogenesis (reviewed in[35]), numerous human RPE cell culture models, including the ARPE-19 cell line[36,37] and primary (fetal) RPE[38], have been used to investigate the molecular pathology of AMD. In recent years, iPSC-RPE cells have emerged as a state-of-the-art model system[39-42]. Several studies have compared hiPSC-RPE cell lines derived from AMD patients to those derived from healthy controls. Those studies reported patient-derived cells to display disease phenotypes associated with AMD such as increased susceptibility to oxidative stress, higher ROS levels upon oxidative stress induction, upregulation of complement genes, and mitochondrial dysfunction[39,41-45]. However, the majority of these studies did not consider the complexity of AMD genetics and regularly focused on a single genetic variant, e.g., the risk-increasing variant CFH Y402H[46], or refrained from genotyping their donors at all[41]. To our knowledge, the iPSC-RPE repository established in this study is a first collection of iPSC-RPE lines in which donors have been selected solely on the basis of their genetic risk profile summarized by a GRS considering risk-increasing as well as protective genetic variants rather than their phenotype. By choosing our donors from the two extreme ends of the genetic AMD risk spectrum, the differences in their genetic risk to develop AMD are comparable with the differences usually seen in monogenic disorders (i.e., the odds ratio between HR and LR can reach values as high as 20)[47].
A distinctive condition believed to play an important role in AMD pathobiology is oxidative stress or, more precisely, an impaired oxidative stress defense in the RPE (reviewed in[48]). With increasing age, a reduced antioxidative capacity of the postmitotic RPE becomes less efficient in neutralizing accumulation of ROS, subsequently resulting in cell degeneration and the initiation of programmed cell death[15,49-51]. NRF2 is a master antioxidant transcription factor in many cell types and NRF2-mediated stress response is known to play a protective role in diseases such as cancer, cardiovascular disease, and Alzheimer’s disease (reviewed in[14,52,53]). Further, Nrf2 deficiency in mice has been shown to lead to an AMD-like phenotype[19]. We therefore chose to examine the response of iPSC-RPE cells with distinct genetic AMD risk profiles to oxidative stress induced by SI via the NRF2 pathway. Of note, in our system, there was no measurable difference in oxidative stress response between HR and LR cell lines. This was also true in experiments after a prolonged SI treatment for 72 h. In unstressed aging mouse RPE, Nrf2-downstream genes Hmox1, Nqo1, and Gclm (glutamate-cysteine ligase regulatory subunit) were found to be upregulated compared to RPE of young mice. This observation was suggested to be caused by an increase in basal oxidative stress with age counteracted by adaptive upregulation of the antioxidant transcripts. Additionally, aged mouse RPE showed impaired induction of the Nrf2 pathway upon oxidative stress with SI[15]. Translating these findings to our iPSC-RPE cell model, differences in the handling of oxidative stress in LR or HR cell lines may only emerge if the cells are cultivated for a longer period of time, as other AMD-associated changes such as drusen formation are known to take several weeks to develop[54]. Additionally, as reviewed in[48], there are many ways to induce oxidative stress in vitro, and, depending on the stressor chosen, cells exhibit different response mechanisms. For example, the chemical stressor paraquat (PQ) was applied to induce a prolonged oxidative stress in iPSC-RPE, ESC-RPE (RPE derived from embryonic stem cells), and ARPE-19 cells. In this study, the expression of NRF2 response genes showed clear dynamics, with HMOX1 and NQO1 being the main NRF2 effectors in the early stress phases and NQO1 and GCLC being significantly increased at week 3[49]. PQ reacts with oxygen to generate superoxide radicals as well as hydrogen peroxide and hydroxyl radicals. It also promotes superoxide radical production in mitochondria, which represents a major source of intracellular ROS more recently leading to a growing interest in the context of AMD pathogenesis[55-57]. Interestingly, NRF2 signaling has been shown to also be involved in mitochondrial homeostasis and metabolism (reviewed in[58]). Even though it is widely appreciated that SI is cytotoxic and causes RPE cell death, the exact mechanism of cellular damage induced by SI remains elusive. A recent study performed in ARPE-19 cells suggests that SI triggers cell death via ferroptosis rather than apoptosis or necrosis[59]. In contrast, another study also using ARPE-19 cells (48 h treatment with SI) showed an increase of NLRP3, Caspase-1, and IL1β, which points more towards pyroptosis as the mechanism of cell death induced by SI treatment[60]. Given the plethora of oxidative stress response mechanisms and the complex interplay of distinct processes suspected to play a role in AMD pathology, drawing finite conclusions from in vitro data to the in vivo situation in AMD patients is a major challenge and needs careful consideration in future research. Additionally, the variety of stressors and treatment durations used in different studies makes it rather difficult to compare in vitro data from different research groups. Several of the studies[39,41-45] that used iPSC-RPE disagree with our results, as those studies did indeed observe differences between AMD patient-derived iPSC-RPE cells and control cells. It should be noted, however, that in the present study a major selection criterion focused on the AMD-related genotypes rather than on phenotypes. Additionally, baseline culture conditions of iPSC-RPE cells are frequently different between different laboratories, making it inherently difficult to compare data from different research groups.
Based on the data presented, we suggest that an extreme GRS for AMD development (high or low) does not correlate with impaired NRF2-mediated oxidative stress response, at least for the short-term treatment conditions chosen, and that HR RPE cells are not more prone to oxidative damage than LR cells or vice versa. The fact that the present study only used rather short stress induction times of 24 and 72 h as well as a single chemical stressor only allows drawing conclusions for this particular in vitro setting. Extending treatment periods towards a more chronic treatment regimen as performed in[49] or using aged RPE cells would reflect a more natural situation and needs to be considered for future studies. Nevertheless, as oxidative stress is regarded as a major risk factor for AMD, a key response mechanism such as the NRF2 pathway may still represent a promising target for therapeutic approaches. Consequently, several NRF2 activators/stabilizers promoting antioxidant gene expression have been proposed as potential therapeutic agents in AMD therapy[49,51,61-63]. Our data fail to reveal differences in NRF2-mediated oxidative stress defense in HR vs. LR cell lines, suggesting that individuals independent of their genetic profile could equally benefit from boosting the oxidative stress response machinery even before first signs of AMD emerge.
DECLARATIONS
AcknowledgmentsWe thank Dr. Ulrike Friedrich (Institute of Human Genetics, University of Regensburg, Germany) for help with the FV3000 confocal microscope, Nico Hertel for technical help with iPSC cultures and RPE differentiations, Ardita Ramadani for support with immunocytochemistry, Sandra Rast for help with iPSC/RPE maintenance and Peter Schönberger for genotyping the AMD patients (all Institute of Human Genetics, University of Regensburg, Germany).
Authors’ contributionsMade substantial contributions to conception, design and supervision of the study and performed data analysis and interpretation; wrote the manuscript: Plössl K, Weber BHF
Contacted and examined AMD patients, obtained biological samples and helped with establishing iPSC cultures: Brandl C
Performed data acquisition and evaluation; provided tables and figures: Webster E, Kiel C, Grassmann F
Availability of data and materialsNot applicable.
Financial support and sponsorshipThe FV3000 confocal microscope was funded by a grant (INST 89/506-1 FUGG, 91b GG) from the Deutsche Forschungsgemeinschaft (DFG) to Weber BHF.
Conflicts of interestAll authors declared that there are no conflicts of interest.
Ethical approval and consent to participateThe culture and differentiation of hiPSC from human donor material were approved by the Ethics Review Board of the University of Regensburg, Germany (reference no. 12-101-0241) and have been performed in accordance with the ethical standards laid down in the 1964 Declaration of Helsinki and its later amendments. Informed consent was given by the probands participating in the study.
Consent for publicationNot applicable.
Copyright© The Author(s) 2022.
Supplementary Materials
REFERENCES
1. Resnikoff S, Pascolini D, Etya'ale D, et al. Global data on visual impairment in the year 2002. Bull World Health Organ 2004;82:844-51.
2. Colijn JM, Buitendijk GHS, Prokofyeva E, et al. EYE-RISK consortium, European Eye Epidemiology (E3) consortium. Prevalence of age-related macular degeneration in europe: the past and the future. Ophthalmology 2017;124:1753-63.
3. Chen Y, Bedell M, Zhang K. Age-related macular degeneration: genetic and environmental factors of disease. Mol Interv 2010;10:271-81.
4. Dalvi S, Galloway CA, Winschel L, et al. Environmental stress impairs photoreceptor outer segment (POS) phagocytosis and degradation and induces autofluorescent material accumulation in hiPSC-RPE cells. Cell Death Discov 2019;5:96.
5. Fritsche LG, Igl W, Bailey JN, et al. A large genome-wide association study of age-related macular degeneration highlights contributions of rare and common variants. Nat Genet 2016;48:134-43.
6. Sobrin L, Seddon JM. Nature and nurture- genes and environment- predict onset and progression of macular degeneration. Prog Retin Eye Res 2014;40:1-15.
7. Beatty S, Koh H, Phil M, Henson D, Boulton M. The role of oxidative stress in the pathogenesis of age-related macular degeneration. Surv Ophthalmol 2000;45:115-34.
8. Cai X, McGinnis JF. Oxidative stress: the achilles' heel of neurodegenerative diseases of the retina. Front Biosci (Landmark Ed) 2012;17:1976-95.
9. Lambros ML, Plafker SM. Oxidative stress and the Nrf2 anti-oxidant transcription factor in age-related macular degeneration. Adv Exp Med Biol 2016;854:67-72.
10. Bird A. Role of retinal pigment epithelium in age-related macular disease: a systematic review. Br J Ophthalmol 2021;105:1469-74.
12. Krohne TU, Kaemmerer E, Holz FG, Kopitz J. Lipid peroxidation products reduce lysosomal protease activities in human retinal pigment epithelial cells via two different mechanisms of action. Exp Eye Res 2010;90:261-6.
13. Jarrett SG, Boulton ME. Consequences of oxidative stress in age-related macular degeneration. Mol Aspects Med 2012;33:399-417.
14. Zhang DD. Mechanistic studies of the Nrf2-Keap1 signaling pathway. Drug Metab Rev 2006;38:769-89.
15. Sachdeva MM, Cano M, Handa JT. Nrf2 signaling is impaired in the aging RPE given an oxidative insult. Exp Eye Res 2014;119:111-4.
16. Wang L, Kondo N, Cano M, et al. Nrf2 signaling modulates cigarette smoke-induced complement activation in retinal pigmented epithelial cells. Free Radic Biol Med 2014;70:155-66.
17. Oh YS, Jun HS. Effects of glucagon-like peptide-1 on oxidative stress and Nrf2 signaling. Int J Mol Sci 2017;19:26.
18. Zhang M, Jiang N, Chu Y, et al. Dysregulated metabolic pathways in age-related macular degeneration. Sci Rep 2020;10:2464.
19. Zhao Z, Chen Y, Wang J, et al. Age-related retinopathy in NRF2-deficient mice. PLoS One 2011;6:e19456.
20. Grassmann F, Fritsche LG, Keilhauer CN, Heid IM, Weber BH. Modelling the genetic risk in age-related macular degeneration. PLoS One 2012;7:e37979.
21. Wang J, Iacovelli J, Spencer C, Saint-Geniez M. Direct effect of sodium iodate on neurosensory retina. Invest Ophthalmol Vis Sci 2014;55:1941-53.
22. Moriguchi M, Nakamura S, Inoue Y, et al. Irreversible photoreceptors and RPE cells damage by intravenous sodium iodate in mice is related to macrophage accumulation. Invest Ophthalmol Vis Sci 2018;59:3476-87.
23. Brandl C, Zimmermann SJ, Milenkovic VM, et al. In-depth characterisation of retinal pigment epithelium (RPE) cells derived from human induced pluripotent stem cells (hiPSC). Neuromolecular Med 2014;16:551-64.
24. Nachtigal AL, Milenkovic A, Brandl C, et al. Mutation-dependent pathomechanisms determine the phenotype in the bestrophinopathies. Int J Mol Sci 2020;21:1597.
25. Biasella F, Plössl K, Karl C, Weber BHF, Friedrich U. Altered protein function caused by amd-associated variant rs704 links vitronectin to disease pathology. Invest Ophthalmol Vis Sci 2020;61:2.
26. Milenkovic A, Brandl C, Milenkovic VM, et al. Bestrophin 1 is indispensable for volume regulation in human retinal pigment epithelium cells. Proc Natl Acad Sci U S A 2015;112:E2630-9.
27. Westenskow PD, Moreno SK, Krohne TU, et al. Using flow cytometry to compare the dynamics of photoreceptor outer segment phagocytosis in iPS-derived RPE cells. Invest Ophthalmol Vis Sci 2012;53:6282-90.
28. Livak KJ, Schmittgen TD. Analysis of relative gene expression data using real-time quantitative PCR and the 2(-Delta Delta C(T)) Method. Methods 2001;25:402-8.
29. R Development Core Team. R: a language and environment for statistical computing. 2010. Available from: http://www.r-project.org/ [Last accessed on 25 Oct 2021].
30. Ogle DH. FSA: fisheries stock analysis. R package version 0.4.31. 2013. Available from: https://github.com/droglenc/FSA [Last accessed on 25 Oct 2021].
31. Fritsche LG, Chen W, Schu M, et al. AMD Gene Consortium. Seven new loci associated with age-related macular degeneration. Nat Genet 2013;45:433-9, 439e1.
32. Pennesi ME, Neuringer M, Courtney RJ. Animal models of age related macular degeneration. Mol Aspects Med 2012;33:487-509.
33. Chen S, Popp NA, Chan C. Animal models of age-related macular degeneration and their translatability into the clinic. Expert Rev Ophthalmol 2014;9:285-95.
34. Abokyi S, To CH, Lam TT, Tse DY. Central role of oxidative stress in age-related macular degeneration: evidence from a review of the molecular mechanisms and animal models. Oxid Med Cell Longev 2020;2020:7901270.
35. Somasundaran S, Constable IJ, Mellough CB, Carvalho LS. Retinal pigment epithelium and age-related macular degeneration: a review of major disease mechanisms. Clin Exp Ophthalmol 2020;48:1043-56.
36. Nashine S, Nesburn AB, Kuppermann BD, Kenney MC. Age-related macular degeneration (AMD) mitochondria modulate epigenetic mechanisms in retinal pigment epithelial cells. Exp Eye Res 2019;189:107701.
37. Catanzaro M, Lanni C, Basagni F, Rosini M, Govoni S, Amadio M. Eye-light on age-related macular degeneration: targeting Nrf2-pathway as a novel therapeutic strategy for retinal pigment epithelium. Front Pharmacol 2020;11:844.
38. Ferrington DA, Ebeling MC, Kapphahn RJ, et al. Altered bioenergetics and enhanced resistance to oxidative stress in human retinal pigment epithelial cells from donors with age-related macular degeneration. Redox Biol 2017;13:255-65.
39. Saini JS, Corneo B, Miller JD, et al. Nicotinamide ameliorates disease phenotypes in a human iPSC model of age-related macular degeneration. Cell Stem Cell 2017;20:635-647.e7.
40. Gong J, Fields MA, Moreira EF, et al. Differentiation of human protein-induced pluripotent stem cells toward a retinal pigment epithelial cell fate. PLoS One 2015;10:e0143272.
41. Cai H, Gong J, Noggle S, et al. NYSCF Global Stem Cell Array Team. Altered transcriptome and disease-related phenotype emerge only after fibroblasts harvested from patients with age-related macular degeneration are differentiated into retinal pigment epithelium. Exp Eye Res 2021;207:108576.
42. Gong J, Cai H, Noggle S, et al. NYSCF Global Stem Cell Array Team. Stem cell-derived retinal pigment epithelium from patients with age-related macular degeneration exhibit reduced metabolism and matrix interactions. Stem Cells Transl Med 2020;9:364-76.
43. Chang YC, Chang WC, Hung KH, et al. The generation of induced pluripotent stem cells for macular degeneration as a drug screening platform: identification of curcumin as a protective agent for retinal pigment epithelial cells against oxidative stress. Front Aging Neurosci 2014;6:191.
44. Golestaneh N, Chu Y, Cheng SK, Cao H, Poliakov E, Berinstein DM. Repressed SIRT1/PGC-1α pathway and mitochondrial disintegration in iPSC-derived RPE disease model of age-related macular degeneration. J Transl Med 2016;14:344.
45. Voisin A, Monville C, Plancheron A, Balbous A, Gaillard A, Leveziel N. hRPE cells derived from induced pluripotent stem cells are more sensitive to oxidative stress than ARPE-19 cells. Exp Eye Res 2018;177:76-86.
46. Ebeling MC, Geng Z, Kapphahn RJ, et al. Impaired mitochondrial function in iPSC-retinal pigment epithelium with the complement factor H polymorphism for age-related macular degeneration. Cells 2021;10:789.
47. Khera AV, Chaffin M, Aragam KG, et al. Genome-wide polygenic scores for common diseases identify individuals with risk equivalent to monogenic mutations. Nat Genet 2018;50:1219-24.
48. Tong Y, Wang S. Not all stressors are equal: mechanism of stressors on RPE cell degeneration. Front Cell Dev Biol 2020;8:591067.
49. Garcia TY, Gutierrez M, Reynolds J, Lamba DA. Modeling the dynamic AMD-associated chronic oxidative stress changes in human ESC and iPSC-derived RPE cells. Invest Ophthalmol Vis Sci 2015;56:7480-8.
50. Hanus J, Anderson C, Sarraf D, Ma J, Wang S. Retinal pigment epithelial cell necroptosis in response to sodium iodate. Cell Death Discov 2016;2:16054.
51. Zhao H, Wang R, Ye M, Zhang L. Genipin protects against H2O2-induced oxidative damage in retinal pigment epithelial cells by promoting Nrf2 signaling. Int J Mol Med 2019;43:936-44.
52. Huang Y, Li W, Su ZY, Kong AN. The complexity of the Nrf2 pathway: beyond the antioxidant response. J Nutr Biochem 2015;26:1401-13.
53. Buendia I, Michalska P, Navarro E, Gameiro I, Egea J, León R. Nrf2-ARE pathway: an emerging target against oxidative stress and neuroinflammation in neurodegenerative diseases. Pharmacol Ther 2016;157:84-104.
54. Galloway CA, Dalvi S, Hung SSC, et al. Drusen in patient-derived hiPSC-RPE models of macular dystrophies. Proc Natl Acad Sci U S A 2017;114:E8214-23.
55. Terluk MR, Kapphahn RJ, Soukup LM, et al. Investigating mitochondria as a target for treating age-related macular degeneration. J Neurosci 2015;35:7304-11.
56. Fisher CR, Ferrington DA. Perspective on AMD pathobiology: a bioenergetic crisis in the RPE. Invest Ophthalmol Vis Sci 2018;59:AMD41-7.
57. Brown EE, DeWeerd AJ, Ildefonso CJ, Lewin AS, Ash JD. Mitochondrial oxidative stress in the retinal pigment epithelium (RPE) led to metabolic dysfunction in both the RPE and retinal photoreceptors. Redox Biol 2019;24:101201.
58. Datta S, Cano M, Ebrahimi K, Wang L, Handa JT. The impact of oxidative stress and inflammation on RPE degeneration in non-neovascular AMD. Prog Retin Eye Res 2017;60:201-18.
59. Liu B, Wang W, Shah A, et al. Sodium iodate induces ferroptosis in human retinal pigment epithelium ARPE-19 cells. Cell Death Dis 2021;12:230.
60. Mao X, Pan T, Shen H, Xi H, Yuan S, Liu Q. The rescue effect of mesenchymal stem cell on sodium iodate-induced retinal pigment epithelial cell death through deactivation of NF-κB-mediated NLRP3 inflammasome. Biomed Pharmacother 2018;103:517-23.
61. Yang Z, Tong Z, Chen Y, et al. Genetic and functional dissection of HTRA1 and LOC387715 in age-related macular degeneration. PLoS Genet 2010;6:e1000836.
62. Xie X, Feng J, Kang Z, et al. Taxifolin protects RPE cells against oxidative stress-induced apoptosis. Mol Vis 2017;23:520-528.
Cite This Article
Export citation file: BibTeX | RIS
OAE Style
Plössl K, Webster E, Kiel C, Grassmann F, Brandl C, Weber BHF. In vitro modeling of the complex retinal condition age-related macular degeneration. J Transl Genet Genom 2022;6:46-62. http://dx.doi.org/10.20517/jtgg.2021.39
AMA Style
Plössl K, Webster E, Kiel C, Grassmann F, Brandl C, Weber BHF. In vitro modeling of the complex retinal condition age-related macular degeneration. Journal of Translational Genetics and Genomics. 2022; 6(1): 46-62. http://dx.doi.org/10.20517/jtgg.2021.39
Chicago/Turabian Style
Plössl, Karolina, Emily Webster, Christina Kiel, Felix Grassmann, Caroline Brandl, Bernhard H. F. Weber. 2022. "In vitro modeling of the complex retinal condition age-related macular degeneration" Journal of Translational Genetics and Genomics. 6, no.1: 46-62. http://dx.doi.org/10.20517/jtgg.2021.39
ACS Style
Plössl, K.; Webster E.; Kiel C.; Grassmann F.; Brandl C.; Weber BHF. In vitro modeling of the complex retinal condition age-related macular degeneration. J. Transl. Genet. Genom. 2022, 6, 46-62. http://dx.doi.org/10.20517/jtgg.2021.39
About This Article
Special Issue
Copyright

Data & Comments
Data


 Cite This Article 19 clicks

 Like This Article 0
likes
Like This Article 0
likes


Comments
Comments must be written in English. Spam, offensive content, impersonation, and private information will not be permitted. If any comment is reported and identified as inappropriate content by OAE staff, the comment will be removed without notice. If you have any queries or need any help, please contact us at support@oaepublish.com.