
Hydroxyurea treatment of sickle cell disease: towards a personalized model-based approach

Abstract
Hydroxyurea is a commonly used drug for the treatment of sickle cell disease. Several studies have demonstrated the efficacy of hydroxyurea in ameliorating disease pathophysiology. However, a lack of consensus on optimal dosing and the need for ongoing toxicity monitoring for myelosuppression limits its utilization. Pharmacokinetic (PK) and pharmacodynamic (PD) studies describe drug-body interactions, and hydroxyurea PK-PD studies have reported wide inter-patient variability. This variability can be explained by a mathematical model taking into consideration different sources of variation such as genetics, epigenetics, phenotypes, and demographics. A PK-PD model provides us with a tool to capture these variant responses of patients to a given drug. The development of an integrated population PK-PD model that can predict individual patient responses and identify optimal dosing would maximize efficacy, limit toxicity, and increase utilization. In this review, we discuss various treatment challenges associated with hydroxyurea. We summarize existing population PK-PD models of hydroxyurea, the gap in the existing models, and the gap in the mechanistic understanding. Lastly, we address how mathematical modeling can be applied to improve our understanding of hydroxyurea’s mechanism of action and to tackle the challenge of inter-patient variability, dose optimization, and non-adherence.
Keywords
Introduction
Sickle cell disease (SCD) is a hereditary disease affecting up to an estimated 100,000 people in the United States and millions worldwide[1]. SCD is caused by a point mutation in the β-globin gene that results in a single nucleotide substitution, changing glutamic acid (GAG) to valine (GTG) in the sixth codon, and subsequently produces abnormal sickle hemoglobin (HbS)[2]. Sickle hemoglobin polymerizes upon deoxygenation in the peripheral microvasculature and forms an elongated, rod-like structure[3]. The polymerized structure stretches the red blood cell (RBC) and deforms the membrane producing rigid and sickle-shaped RBCs[4]. The sickled RBC adheres to endothelial cells and is responsible for the vaso-occlusive crisis[5]. The primary clinical effects associated with vaso-occlusive complications are painful episodes, acute chest syndrome, and stroke[3]. Sickle cell anemia (SCA) describes the homozygous condition when both the genes for β-globin (βs) are mutated, and SCA is represented by the HbSS genotype[4,5]. Besides the homozygous HbSS genotype, other genotypes of SCD include heterozygous sickle-cell/β0 thalassemia (HbS/β0), sickle-cell/β+ thalassemia (HbS/β+), sickle-cell/hemoglobin C disease (HbSC), and other rare genotypes[5,6]. A wide degree of phenotypic variability is observed in addition to genetic variability[7].
Mathematical models have been developed for several diseases, such as hematological malignancies, solid tumors, diabetes, and human immunodeficiency viruses (HIV), to address the ongoing treatment challenges ranging from improving the existing drug dosing regimen to the effective management of the disease adverse events. A model-guided dosing strategy can be applied to predict drug-dependent efficacy and toxicity at multiple stages of treatment. For example, the pharmacokinetic-pharmacodynamic (PK-PD) modeling of the drugs cisplatin and etoposide for small-cell lung cancer identified three new dosing regimens with a better reduction in tumor size compared to standard protocol while satisfying toxicity constraints for neutrophil and platelet counts[8]. Similarly, Houy and Grand determined optimal chemotherapy regimens for temozolomide using the PK-PD modeling[9]. The model showed that the toxicity of metronomic chemotherapy could be reduced while achieving the same level of efficacy[9]. Another successful use of a model-based approach in treatment efficacy was to personalize the 6-mercaptopurine treatment of acute lymphoblastic leukemia[10,11]. The model factored in the patient-specific variations in enzyme, thiopurine methyltransferase (TPMT), activity to obtain optimal dose. The study showed that a lower dose is needed for a patient with low TPMT enzyme activity than the standard dose[10]. Mathematical model-based approaches have been developed for diabetes, where both clinical and non-clinical models are available[12]. The clinical models include models developed for describing diagnosis, control, progression, and complications. The non-clinical models aid in unraveling the mechanism of insulin-glucose dynamics on multi-scale levels[12]. Mathematical models have also been used to study HIV dynamics, to understand disease progression, and to improve treatment[13]. Similar mathematical modeling approaches can be leveraged for describing SCD progression and the influence of hydroxyurea on disease modification.
The need for a model-based approach arises from the treatment challenges faced by clinicians in managing SCD. In this review, we discuss the challenges associated with hydroxyurea treatment. The pharmacokinetics and pharmacodynamics of hydroxyurea are discussed with a focus on population PK-PD modeling. This review elaborates on building a personalized treatment strategy by formulating patient PK-PD models and integrating them. The modeling strategy can be applied to predict an individual patient’s treatment response trajectory with time and determine personalized dosage.
Treatment approaches
The treatment approach for SCD varies from patient to patient depending on the stage of the disease and clinical severity. The treatment includes two types of strategies: targeting the relief of symptoms and targeting the prevention of symptoms[14]. The treatment approaches for relief of symptoms include blood transfusion and administration of antibiotics, opioids, and analgesics[3,14]. The treatments for symptoms prevention include induction of fetal hemoglobin (HbF), targeting HbS polymerization, targeting complications downstream of HbS polymerization, and curative intent therapies, which have recently been reviewed elsewhere[15,16]. This manuscript focuses on the application of hydroxyurea and the rationale for the development of an integrated population PK-PD model that may predict individual patient responses to therapy and identify optimal dosing strategies.
Fetal hemoglobin (HbF; α2γ2), the primary form of hemoglobin produced during fetal life, consists of two α-globin subunits and two γ-globin subunits. After birth, expression of HbF is silenced as individuals transition to adult hemoglobin (HbA; α2β2) production. Since individuals with SCA produce HbS instead of HbA, HbS polymerization leads to symptoms of SCA[17]. Fetal hemoglobin inhibits HbS polymerization by directly interfering with polymerization and by reducing the concentration of HbS production[18]. Hence, the elevation of HbF levels ameliorates the severity of SCA[18]. The FDA approved drug for SCA that induces HbF is hydroxyurea (HU). Prior to being identified as a therapy for SCA, HU was used as a chemotherapeutic agent and in the treatment of HIV[19,20]. In individuals with SCA, HU reactivates HbF production, thereby decreasing HbS polymerization, as discussed previously. The therapeutic effects of HU include: increase in total hemoglobin by prolonging RBC life span; improvement in RBC hydration, thereby decreasing HbS concentration and reducing polymerization; improvement in RBC rheology; reduction of RBC-endothelial adhesion; and the potential increase in nitric oxide (NO), a potent vasodilator[17,21]. Hydroxyurea inhibits ribonucleotide reductase, an enzyme essential for DNA synthesis, thereby causing myelosuppression[22]. Hydroxyurea is also associated with the normalization of usually elevated white blood cells (WBC) by the primary effects of myelosuppression and the secondary effects of reducing ischemic damage in the microvasculature[17,23,24].
Long-term follow-ups of HU treatment showed increased survival of patients with no increased risk of stroke, infection, or neoplasia[25,26]. Since HU therapy is associated with transient myelosuppression, routine monitoring of blood counts is recommended during therapy[14]. Routine laboratory monitoring during HU therapy showed that individuals with SCA have an increased percentage of fetal hemoglobin (HbF%), total hemoglobin level, and mean corpuscular volume (MCV)[27,28]. Although there is a large degree of individual variability in response, increases in HbF% and MCV in HU-treated patients can be used as a surrogate for medication adherence and clinical efficacy[29,30].
Hydroxyurea treatment challenges
Heterogeneity of the disease and response
The type and degree of severity of SCD disease manifestations vary widely from patient to patient, likely due to complex interactions between genetic and environmental disease modifiers. Additionally, patients with SCD have a variable response to treatment with HU[31]. Some patients respond well, and some are poor responders to HU as determined by the percentage increase in HbF[21,27]. One therapeutic approach for HU treatment is the personalization of a maximum tolerated dose (MTD) determined for individual patients after careful monitoring of biomarkers and treatment response[29,31]. However, there is wide inter-patient variability in the PK-PD of the drug inside the body[32-35]. This variability may arise due to each patient having a different genetic, metabolic, and physiological makeup.
Timely and optimal prediction of dose
Clinicians define MTD using an adaptive dosing approach. In this empirical approach, the dosing starts at 15-20 mg/kg, and the patient is monitored for excessive myelosuppression at the 4-6 weeks mark[14]. The dose is then increased in steps of 5 mg/kg every eight weeks up to a maximum of 35 mg/kg[14]. The therapeutic goal is to achieve an absolute neutrophil count of 1500-3000 cells/µL. The MTD determination usually takes 9-12 months of treatment. If the optimal dose can be determined earlier using mathematical modeling, the time to MTD can be reduced, and, as a result, maximum benefits from HU can be extracted.
Non-adherence to treatments
Non-adherence presents a significant challenge for clinicians. The effect of HU is maximized with adherence to daily administration, and the benefits wane with non-adherence. Clinically, it is challenging to differentiate treatment inefficacy from non-adherence, and doctors may confuse the non-adherence to the patient being treatment refractory. Thornburg et al.[36] evaluated adherence in children with SCA treated on HU therapy and found that good adherence led to an increase in HbF% inferred from a moderate association between HbF% and Morisky score and number of refills. Brandow and Panepinto classified barriers to the use of hydroxyurea as provider-related, patient-related, and system-related ones[37]. They identified several barriers to adherence to HU therapy: the delayed benefits of HU, fear of drug side effects, expected frequent treatment monitoring, forgetfulness, and poor access to healthcare[36,37].
Need for effective biomarkers
The biomarkers currently in use are HbF and MCV of RBC, both of which increase with HU treatment[27]. However, they take some time to reach a steady-state, and there is a large degree of intra-patient variability in response. Therefore, there is a need for a better biomarker to detect treatment efficacy earlier.
Incomplete understanding of the drug mechanism
The mechanism of HU-induced HbF stimulation is not known, and the transporters, enzymes, metabolites, and signaling molecules involved in HU PK-PD are not known. The potential role of organic anion transporting polypeptides (OATP) as HU transporters was investigated[38,39]. Studies showed that metabolites such as urea, nitric oxide were produced, and enzymes such as monooxygenase and catalase were involved in the metabolism of HU[40-42]. Studies have indicated the nitric oxide-cyclic guanosine monophosphate signaling pathway or p38 mitogen-activated protein kinase pathway to be activated when HU is administered in vitro[43-45]. Understanding the drug mechanism will help in advancing the HU treatment further.
Myelosuppression
As mentioned above, HU inhibits enzyme ribonucleotide reductase, which causes bone marrow toxicity[2]. A dose-dependent decrease in neutrophils and reticulocytes follows HU administration. HU-induced increase in HbF% is correlated to change in MCV, neutrophils, and reticulocytes count[21]. Neutrophil count < 2000/µL, reticulocyte count < 80,000/µL, platelet count < 80,000/µL, and hemoglobin concentration < 4.5 g/dL are considered excessive myelosuppression[21]. When excessive myelosuppression events are repeated, the treatment is withheld for 1-2 weeks until cell counts normalize[46]. Following this, HU is resumed at a lower dose than the toxic dose.
All these challenges reflect the need for a mathematical model to address and further explore mechanisms of HbF activation. We need a treatment regimen guided by patients’ history and patient-specific variables to decide an adequate dose for every patient. The standard clinical practice of determining the MTD is time and effort consuming and requires constant monitoring of the patient. A mathematical model would be clinically useful in predicting the inter-patient variability by considering individual patients’ biochemical and genetic composition and demographic variables. A mathematical model will also help the timely and optimal dosage prediction by maximizing efficacy and minimizing toxicity. Through the model, we can look for alternative biomarkers that do not take a longer time to reach a steady-state.
Pharmacokinetics and pharmacodynamics of hydroxyurea
Hydroxyurea is used for the treatment of cancer, HIV, and sickle cell disease. Pharmacokinetics mainly consists of four processes: absorption, distribution, metabolism, and excretion (ADME). Hydroxyurea administered orally is well absorbed and shows good bioavailability of 79% or more[19,47]. Studies showed that the rapid absorption, distribution, and elimination might be facilitated by solute carrier (SLC) transporters belonging to OATP families and urea transporters[38,39]. The distribution of HU is rapid, and the volume of distribution approximates total body water volume[19,48]. The drug concentration in the blood achieves rapid equilibrium with that in the tissues and fluids[49]. Hydroxyurea is eliminated through hepatic and renal pathways[48]. In the in vitro experiments performed, hydroxyurea was metabolized to urea in mouse liver and kidney[40,50]. Another study showed the involvement of the mouse liver monooxygenase system in the metabolism of HU into urea[41]. The other possible metabolites from hydroxyurea were identified as hydroxylamine, nitric oxide, nitrite, and nitrate[51]. From the pharmacokinetic studies, it is observed that the drug is eliminated both linearly and nonlinearly. One study demonstrated that, when administered intraperitoneally, the majority of HU was recovered as an unchanged drug and urea from the urine of mice[50]. The drug pharmacokinetics is modeled to gain insight into the ADME processes and make predictions on the amount of drug and metabolites present in the plasma, tissues, and organs and the changes in them with time. The predictive PK model aid in estimating drug exposure and the effect of drug exposure on efficacy and toxicity.
Pharmacokinetic modeling
Pharmacokinetic models are formulated using a compartment modeling approach. The whole body is assumed to be a system that is divided into a series of compartments where each compartment consists of organs and tissues with similar drug distribution profiles[52]. The following factors are considered while constructing a compartment model of the drug pharmacokinetics: (1) elimination (central and/or peripheral); (2) absorption and elimination rates (linear or nonlinear); and (3) administration (orally or intravenously)[52]. The compartment model’s performance in predicting the concentration-time relationship is evaluated using criteria such as Akaike information criteria (AIC), Bayesian information criteria (BIC), and likelihood test ratio (LRT) that balances between the goodness of fit and model complexity[19,33,34].
Population PK studies help to model individual patients and incorporate inter-patient, intra-patient, and inter-study variability in drug pharmacokinetics. Population PK modeling uses nonlinear mixed effect (NLME) models. The NLME modeling is a two-stage hierarchical model with individual and population models, and NLME considers fixed effects and random effects. A structural PK model is constructed using a compartment modeling approach. The inter-individual variability (IIV) is incorporated by taking parameters, θ, as a function of an average parameter (fixed effect),  , from the population, and an error term (random effect), η, which describes the individual deviation from average parameter value. The random variable, η, is assumed to be normally distributed with mean 0 and variance ω2. The parameters are further expressed as a function of covariates, which are individual-specific clinical, laboratory, or demographic variables. The covariate selection for a particular parameter is made if it lowers the model’s objective function value compared to when the covariate is not selected[53]. Intra-individual variability or residual variability (RV) is introduced into the model by a residual error, ε, expressed as the difference between the observed variable, y and the output from the model. The residual error, ε, is assumed to be normally distributed with mean 0 and variance σ2. This random variability can arise due to variability in assay, error in sample collection, and model misspecification[53]. The following equation provides a generalized formulation of NLME modeling:
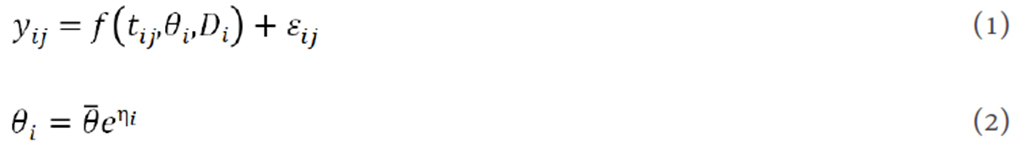
where yij is the observed drug concentration of ith individual at jth time and f denotes the structural model output with tij as time and θi and Di as PK parameters and dose for ith individual. The i subscript denotes the value of the corresponding variables/parameters for the ith individual. The j subscript denotes the corresponding variables/parameters at jth time. The residual error shown above is an additive term in the model output. Other types of residual error models are proportional, exponential, combined additive and proportional, and combined additive and exponential functions of ε[53]. The IIV is described in Equation (2) using an exponential function. The other functions used to describe IIV are additive and proportional. Population PK studies have been done in cancer and SCA patients.
Pharmacokinetic studies of HU in HIV described the HU plasma concentration–time data with a one- or two-compartment model with first-order absorption and first-order elimination[20,47]. One study demonstrated a significant correlation between predicted and observed serum concentrations of hydroxyurea[20]. Tracewell et al.[19] studied population PK of HU in cancer patients. A one-compartment model fitted the patients’ data with elimination through the metabolic and renal pathways. Michaelis-Menten kinetics was used for metabolic elimination, and a first-order rate equation was used for renal elimination[19]. The IIV for the volume of distribution, V, was assumed to be proportional to the average value through the following equation[19]:

where Vi is ith individual V,  is the average V of population, and ηVi is the random variable that denotes IIV. To account for RV, the residual error model was described by the proportional function given below[19]:

where yMij is the model-predicted drug concentration of ith individual at jth time.
The PK-PD studies in cancer and HIV patients found one- or two-compartment models with first-order absorption and first-order or Michaelis-Menten elimination to best fit the drug concentration-time profile[19,20,47]. In the case of SCD, Ware et al.[32] studied the PK after the first dose of HU using non-compartmentalized PK analysis. They observed two categories of patients with varying absorption profiles, slow and fast, and with varying drug exposure. The apparent clearance, CL/F, depends on the weight of the patient, as determined from the least-squares regression fit. Univariate and multivariate linear regression was done to identify significant covariates for CL/F. The coefficient of variation in PK parameters described the IIV. In multivariate analysis, covariates related to CL/F were weight, alanine aminotransferase (ALT), and serum creatinine[32].
The population PK-PD model in SCA patients developed by Paule et al.[33] captured the relationship between exposure-efficacy and corresponding variability in PK-PD. The second-order conditional estimation method was used to obtain the PK parameter estimates with the interaction between inter-individual and residual variabilities. The two-compartment model with first-order absorption and first-order elimination fitted the PK data best. The combined additive and proportional residual error model described the RV, as shown below[33]:

where εpij and εaij are the proportional and additive residual random errors, respectively. A scaling factor for the central volume of distribution, Vc, and clearance, CL, was used to scale these parameters by body weight (BW) of a 70-kg patient. The scaling was done to adapt the model to children, as given by the following equation[33]:

where θVc and θCL are the Vc and CL of a 70-kg patient. The IIV was high for Vc, CL, ka, absorption rate constant, and kcp, the rate constant for transit from central to peripheral compartment. The IIV in PK parameters was assumed to be an exponential function of η, as shown in Equation (2). The model performance was evaluated using a simulation-based diagnostic tool, visual predictive check (VPC). Based on the VPC results, the model gave good fits with the observed PK data[33].
Similarly, Wiczling et al.[34] developed a population PK model to capture the variation of HU concentration in plasma and urine with time. In this study, a one-compartment model with first-order elimination through renal and non-renal pathways provided good fits to the data. Additionally, a gamma-distributed absorption rate (transit absorption model) was used owing to the delay in absorption observed in several patients. In the transit absorption model, the absorption compartment consists of Nt transit compartments, and the input to the central compartment, u(t), was given by the following equation[34]:

where F is the bioavailability, D is the drug dose, and ktr is the transit rate in between compartments. ktr is given by (Nt + 1)/MTT, where MTT is the mean transit time. The proportional residual error model given by Equation (4) was used to account for RV[34]. The following equation gave the individual parameters:

where θi and θmedian are the PK parameters for the ith individual and median covariate, COVi is the continuous covariate of ith individual, COVmedian is the median value for a particular covariate, and θCOV is the regression coefficient. The weight was identified as a significant covariate for the apparent volume of distribution, V/F, and CL/F due to the metabolic pathway. The model performed well, as evaluated from the goodness of fits, VPC plots, and the individual patient fits obtained for the variation of HU plasma concentration and HU urine amount with time[34].
In another study, Estepp et al.[35] performed a population PK study in children with SCD. The model was similar to the model developed earlier by Wiczling et al.[34]. However, elimination through only one pathway was considered. The study participants received HU in capsule and liquid forms. Since the drug was administered on two occasions, the model expressed the PK parameters as a function of two random variables to account for inter-individual (η) and inter-occasion variability (k)[35].

where θik is the set of PK parameters for ith individual and kth occasion. Vc and CL were expressed as functions of bodyweight using Equation (5). They showed that their model adequately described the data based on the goodness-of-fit plots and VPC plots for liquid and capsule formulations. The individual patients fit for PK data in patients receiving the liquid and capsule formulations showed that the model simulation matched the observed data well[35].
Dong et al.[54] developed a dosing strategy using individual patient PK profile to reduce the time to reach MTD and maximize the effect of HU. Using D-optimal design, they identified that only three plasma samples at sampling times of 15-20 min, 50-60 min, and 3 h post-dosing are needed to estimate HU exposure. They described the relationship between the average PK parameter and continuous covariates shown in the following equations by normalized power models or linear models[54]:

where θ1 is the regression coefficient.
In this study, the PK data were best fitted by a one-compartment model with absorption described by the transit absorption model given by Equation (7) and elimination described by the Michaelis-Menten equation with the elimination rate given by kmaxy/(y + KM), where kmax is the maximum elimination rate, y is the drug plasma concentration, and KM is the Michaelis-Menten constant[54]. Weight and cystatin C, a marker of kidney function, were identified as significant covariates for kmax and weight was identified as a significant covariate for V/F. The elimination of HU decreased with an increase in cystatin C concentration with a corresponding increase in area under the concentration-time curve (AUC). A power model was used to describe the relationships of kmax and V/F with the covariate weight[54]. The IIV was described by an exponential model as given by Equation (2). The RV was described by a combined additive and proportional model, as given by Equation (5). The model gave good fits with the observed PK profile, as seen from goodness-of-fit plots and VPC[54]. McGann et al.[55] validated the strategy of PK-guided dosing developed by Dong et al.[54] to determine the time to reach MTD. The population PK model developed by Dong et al.[54] showed that the time to reach MTD could be reduced from 6-12 to 4.8 months, and the starting dose could be increased from 20 mg/kg/day to an average of 27.7 mg/kg/day with a corresponding increase in hemoglobin and HbF[54,55].
From these studies, it can be concluded that the population PK models adequately described the clinical data under various settings. Table 1 summarizes the PK models developed for SCD patients and reviewed in this section. Together, these studies indicate the ability of compartment models embedded into the statistical framework of NLME models to describe the average behavior and individual behavior of patients. For SCD, the structural model for describing average PK data consisted of either one or two compartments[33,34]. In HU studies in SCD patients, a linear or nonlinear absorption rate was used, and, for the typical dose of 20 mg/kg/day used in SCD, a linear elimination was sufficient to describe the PK trajectory[33,34]. When the dose is high, as in cancer patients, the elimination occurred via linear and enzymatic pathways[19]. However, in a recent study in sickle cell patients, Michaelis-Menten elimination was used to fit the PK data[54]. Weight was identified as a significant covariate for CL and V, as it lowered the objective function value[32-35,54]. However, the ADME processes for hydroxyurea are still not fully understood. The variability in the level of protein, lipids, and small molecules involved in ADME of the drug, such as the transporter protein OATP1B, might be responsible for the variability in patients’ PK. Therefore, understanding the ADME processes will help in building a mechanism-based model and strengthen the predictive ability of the population PK model. The studies highlighted here implemented PK modeling strategies; however, there is a need to link the PK model with the PD model.
Summary of hydroxyurea pharmacokinetic (PK) models for sickle cell patients
| Individual patients PK model | Individual PK parameter estimation | PK model | Parameters - predictors/covariates | IIV | RV |
|---|---|---|---|---|---|
| Ware et al.[32] | Univariate and multivariate linear regression | Noncompartmental PK analysis | CL/F - weight, ALT, serum creatinine | Coefficient of variation | |
| Paule et al.[33] | NLME model | Two-compartment model
• First-order absorption • First-order elimination | CL - weight
V - weight | Exponential model | Combined additive and proportional model |
| Wiczling et al.[34] | NLME model | One compartment model
• Transit absorption model • First-order renal and non-renal elimination | CL/F - weight
V/F - weight | Exponential model | Proportional model |
| Estepp et al.[35] | NLME model | One compartment model
• Transit absorption model • First-order elimination | CL - weight
V - weight | Exponential model and exponential model for inter-occasion variability | Proportional model |
| Dong et al.[54] | NLME model | One compartment model
• Transit absorption model • Michaelis-Menten elimination | CL/F - weight, cystatin C
V/F - weight | Exponential model | Combined additive and proportional model |
Pharmacodynamic modeling
The majority of the models developed for HU describe the PK and the variability in the PK profile of patients. There is very little research done in the area of PD modeling of HU. There is a difference in the timescale of PK and PD variables. The changes in PK variables occur on the scale of hours, while changes in PD variables occur over weeks. The long-term usage of HU causes a significant increase in the percentage of HbF and MCV of RBC[28].
Ware et al.[32] did a univariate and multivariate analysis between PK and PD variables and covariates and PD variables. The PD variables were HbF% at MTD and the MTD itself. Multivariate modeling identified five significant variables related to HbF% and MTD, as listed in Table 2. However, multivariate linear regression could not adequately predict HbF% and MTD[32].
Summary of hydroxyurea pharmacodynamic (PD) models for sickle cell patients
| Individual patients PD model | PD model | Parameters - predictors/covariates | IIV | RV |
|---|---|---|---|---|
| Ware et al.[32] | Univariate and multivariate linear regression | HbF% at MTD - baseline HbF, baseline total bilirubin, baseline ARC, age, height, cystatin C MTD - creatinine, weight, BSA, age, height, BMI %HbF at MTD - baseline HbF, baseline total bilirubin, baseline ARC, BMI, MRT∞ MTD - baseline creatinine, baseline ARC, baseline BMI, half-life, fast PK phenotype | Coefficient of variation | |
| Paule et al.[33] | NLME model (individual parameter estimation),
turnover PD models with inhibition of the elimination rate | HbF% production rate, Kin – ΔMCV
MCV parameter, β - ΔHbF% | Exponential model | Proportional model |
The mechanism through which HU generates a specific response is not fully understood. To predict the change in response without knowing the exact mechanism of the drug action, four basic types of structural models (turnover models) have been used for describing drug response as a function of drug plasma concentration[56]. A general form of these models is shown in the following equation:

These four turnover models involve: (1) stimulation or inhibition of the rate of production (Kin); and (2) stimulation or inhibition of the rate of elimination (Kout) of the response variable (R) by the drug plasma/biophase concentration. The turnover models have been investigated to correlate the change in MCV and HbF% with HU[33]. In sickle cell patients, two models, for two response variables, HbF% and MCV, were tested: (1) HU-mediated stimulation of Kin; and (2) HU-mediated inhibition of (Kout). For HbF% dynamics, the elimination rate was modeled as  , where (1 - Imax) is an inhibitory function. This model could not correlate HbF% and plasma drug concentration for the given dataset. For MCV dynamics, the elimination rate was modeled as Kout(1 - βy-γ), where
  is the average drug concentration and
  is the inhibitory function. To explain the variability in responses of patients, the NLME model was used[33]. The proportional residual error model in the form of Equation (4) was used to explain RV for HbF% and MCV. The exponential models in the form of Equation (2) were used to describe the IIV for both HbF% and MCV model parameters (Kin, Kout, Imax, and β). For HbF%, Kin has an exponential dependence on ΔMCV (change in MCV/day) as a significant covariate. For MCV, β has an exponential dependence on ΔHbF% (change in HbF%/day) as a significant covariate. The comparison between the population PD model results and the observed HbF% and MCV data using VPC showed that the model’s performance was acceptable[33].
The study also compared two dosing regimens: (1) a daily dose of 1000 mg for seven days; and (2) a daily dose of 1000 mg for five consecutive days followed by an interruption of two days[33]. For patients with the highest HbF% level, continuous dosing resulted in stronger response (quantified by a higher HbF%) as compared to dosing with a two-day interruption. The effect of missing the dose on two days in a week was cumulative as the difference in HbF% continued to increase with every week. The two different dosing schemes did not seem to alter MCV dynamics significantly[33].
The percentage changes in HbF and MCV increase in HU treatment. There are very few PD models developed, and only one of them describes the change in the HU response variables with the change in the drug concentration. The PD modeling approach has focused on relating efficacy with drug exposure. A model that can relate both drug toxicity and drug efficacy with drug exposure is needed to obtain a dose that maximizes efficacy and minimizes toxicity. Table 2 summarizes the PD models developed for SCD patients and reviewed in this section. A PD model able to correlate drug biophase/plasma concentration with MCV of RBC and HbF will be useful for predicting individual patient trajectory with time and will reduce clinicians’ waiting time in reaching the individual specific dose. Additionally, genetic polymorphisms were seen in patients treated with HU in genes associated with HU metabolism, erythroid progenitor proliferation, and HbF expression[57]. Incorporation of genetic polymorphisms in the population PD model will help in better explaining the IIV in response. In PD modeling, an indirect response or turnover model is useful to correlate change in HbF and MCV with HU exposure. However, for a detailed approach, a mechanistic model needs to be developed. Several studies were conducted to investigate the signaling pathway involved in the mechanism of HU-mediated reactivation of HbF.
Hydroxyurea signaling pathway
HU increased nitric oxide (NO) and activated soluble guanylyl cyclase (sGC)[43,58-60]. sGC induced γ-globin gene expression, mediated by cyclic guanosine monophosphate (cGMP)[44,61]. The role of p38 mitogen-activated protein kinase (MAPK) in HbF activation has been studied[45,62-64]. Phosphorylation of p38 MAPK increased in HU responsive erythroid cells while it was unaffected in HU resistant cells[65]. In some studies, NO stimulated p38 MAPK phosphorylation through cGMP-dependent protein kinase (PKG)[66,67]. In separate studies, the transcription factors such as BCL11A, KLF1, and SOX6 silenced γ-globin gene expression[68-70]. The HU treatment reduced the expression of repressors, which activated the γ-globin gene[71]. Additionally, HU induced immediate reduction in WBCs adhesion to vascular endothelium and reduction in WBC-RBC interaction, which are associated with the vaso-occlusive crisis. The studies have shown the potential role of the NO-cGMP signaling pathway in HU induced anti-inflammatory effects[72,73].
The HU induced HbF synthesis is represented by a proposed signaling pathway, as shown in Figure 1. In the figure, HU is metabolized to NO. Then, NO binds to sGC and activates it. The activated sGC (sGC*) converts GTP to cGMP. The transcription factors that silence the γ-globin gene expression are all combined into TFr. HU activates p38 MAPK (p38 MAPK*) as well. The HU-dependent cGMP production and p38 MAPK activation inhibit the expression of TFr. As a result, the reduced expression of TFr promotes γ-globin gene expression and, consequently, HbF production.

Figure 1. Proposed hydroxyurea signaling pathway. HU: hydroxyurea; NO: nitric oxide; sGC: soluble guanylyl cyclase; GTP: guanosine triphosphate; cGMP: cyclic guanosine monophosphate; p38 MAPK: p38 mitogen-activated protein kinase; TFr: repressor; solid line: activation; dashed line: repression; asterisk: activated form
The signaling pathway plays a significant role in HU-induced HbF stimulation. Hence, a deeper understanding of the signaling network is needed. Further studies are needed to establish the role of the HU-NO-sGC-cGMP and HU-p38 MAPK pathways in HbF activation. We also need to investigate how cGMP and p38 MAPK are correlated with transcription factors such as BCL11A, KLF1, and SOX6, which silence the γ-globin gene, and this will shed light on how HU turns on the switch for HbF synthesis. The signaling network shown in Figure 1 needs to be modeled to capture the HbF dynamics along with HU dynamics. The predictive model can be used to guide future experiments to explore and fill the gap in our understanding of the possible mechanism of HbF induction. The reason for studying a signal transduction-based PD model is that it will give better insight into understanding the drug-cell interaction.
Discussion and future direction
The majority of studies validate the safety and efficacy of long-term usage of HU treatment for SCD[25,26]. However, variability in patient response across the population and the variability of an individual patient response with time demands continuous monitoring of the drug in patients. The standard dosing scheme followed in a clinical setting to understand the relationship between dose and response provides a framework for the development of computational approaches. A mathematical model provides us with a tool to capture the variant responses of patients against a given drug. Based on the current HU treatment challenges for SCD patients, the following directions can be pursued for future research initiatives.
Optimal dose determination
Patients currently undergo a trial-and-error approach for clinicians to determine their MTD. Sometimes this approach might cause excessive or inadequate dosing, which will cause either cytotoxicity or ineffective treatment. To minimize excessive myelosuppression and maximize drug efficacy, the optimal drug dosage needs to be determined based on the response predicted from a PK-PD model for an individual. The PK model needs to be integrated with the efficacy and toxicity models to characterize kinetics with both efficacy and toxicity. The modeling can include the three components Kinetics Model, Efficacy Model, and Toxicity Model, as shown in Figure 2. The kinetics model will calculate HU plasma (yp) and metabolites (ym) concentration dynamics with HU dose as the input. For this, the already existing PK models can be used. Using yp and ym as the inputs, the efficacy model will calculate HbF and MCV with time, and the toxicity model will calculate absolute neutrophil count (ANC) and absolute reticulocyte count (ARC) with time.

Figure 2. A modeling framework for optimal dose calculation. D(t): HU dose; yp:HU plasma concentration; ym: metabolite concentration; HbF: fetal hemoglobin concentration; MCV: mean cell volume of red blood cell; ANC: absolute neutrophil count; ARC: absolute reticulocytes count
Quantify non-adherence
As described in the section on Hydroxyurea Treatment Challenges, there is a need to quantify non-adherence using a mathematical model that can predict patient response and differentiate non-adherent patients from non-responders.
In PK-PD studies of HU, it is seen that there is a time lag in the drug expression in the plasma and the drug response. The timescale for change in HU in the plasma is in hours, as observed from PK studies[32,34,35]. However, the change in the response variables is seen after weeks of hydroxyurea exposure[21,27]. The reason behind the time lag in the PK-PD profiles of HU is not fully understood. The underlying mechanism of how HU stimulates HbF synthesis, how it increases the MCV of RBC, and how it causes myelosuppression is not fully understood. To address the above, the various factors influencing the PK-PD trajectory of HU need to be understood. Further work needs to be done to identify the HU transporters, metabolites, and enzymes involved. The signaling pathway involved in HbF stimulation needs to be identified through new experiments. The mechanism of how HU affects cells in the different stages of hematopoiesis will aid in elucidating the drug-dependent myelosuppression.
The current state of mathematical model development in HU treatment of SCD patients aims towards building a population PK-PD model to predict individual patient PK and the relation between exposure and efficacy [Tables 1 and 2]. The recent developments in population PK models have shown promising results in predicting varying PK profiles of patients[33-35,54]. However, there has been little effort to link the PK and PD models of HU. Besides, the PD model only considered efficacy and did not include toxicity[33]. A detailed PD model based on HU efficacy and toxicity is needed, which can predict the dynamics of individual patient response and can be tweaked to generate the desired response. There is also a need to integrate the systems biology approach with PK-PD modeling to develop mechanistic models of the drug-disease dynamics. Mathematical models can give new insight and improve the understanding of the mechanism of SCD progression and modification in the presence of HU, thereby advancing the treatment and improving the quality of life of SCD patients.
Declarations
AcknowledgmentsPandey A would like to thank Lina Aboulmouna, Kaushal Jain, and Parul Verma for reviewing the manuscript.
Authors’ contributionsReviewed literature and wrote the manuscript: Pandey A
Provided critical review and editing of the manuscript: Estepp JH
Provided critical review of the manuscript: Ramkrishna D
Availability of data and materialsNot applicable.
Financial support and sponsorshipPandey A received financial support from Davidson School of Chemical Engineering, Purdue University.
Conflicts of interestEstepp JH receives research funding support from Global Blood Therapeutics, Forma Therapeutics, Pfizer, and Eli Lilly and Co. Estepp JH provides consultancy to Daiichi Sankyo, Esperion, and Global Blood Therapeutics. Estepp JH also receives research funding support from American Society of Hematology (ASH) and National Heart, Lung, and Blood Institute (NHLBI). The other authors declare no conflicts of interest.
Ethical approval and consent to participateNot applicable.
Consent for publicationNot applicable.
Copyright© The Author(s) 2021.
REFERENCES
1. Brawley OW, Cornelius LJ, Edwards LR, et al. National Institutes of Health Consensus Development Conference statement: hydroxyurea treatment for sickle cell disease. Ann Intern Med 2008;148:932-8.
5. Frenette PS, Atweh GF. Sickle cell disease: old discoveries, new concepts, and future promise. J Clin Invest 2007;117:850-8.Fi.
8. Faivre C, El Cheikh R, Barbolosi D, Barlesi F. Mathematical optimisation of the cisplatin plus etoposide combination for managing extensive-stage small-cell lung cancer patients. Br J Cancer 2017;116:344-8.
9. Houy N, Le Grand F. Administration of temozolomide: Comparison of conventional and metronomic chemotherapy regimens. J Theor Biol 2018;446:71-8.
10. Jayachandran D, Rundell AE, Hannemann RE, Vik TA, Ramkrishna D. Optimal chemotherapy for leukemia: a model-based strategy for individualized treatment. PLoS One 2014;9:e109623.
11. Jayachandran D, Laínez-Aguirre J, Rundell A, et al. Model-Based Individualized Treatment of Chemotherapeutics: Bayesian Population Modeling and Dose Optimization. PLoS One 2015;10:e0133244.
12. Ajmera I, Swat M, Laibe C, Le Novère N, Chelliah V. The impact of mathematical modeling on the understanding of diabetes and related complications. CPT Pharmacometrics Syst Pharmacol 2013;2:e54.
13. Wodarz D, Nowak MA. Mathematical models of HIV pathogenesis and treatment. Bioessays 2002;24:1178-87.
14. Yawn BP, Buchanan GR, Afenyi-Annan AN, et al. Management of sickle cell disease: summary of the 2014 evidence-based report by expert panel members. JAMA 2014;312:1033-48.
15. Telen MJ, Malik P, Vercellotti GM. Therapeutic strategies for sickle cell disease: towards a multi-agent approach. Nat Rev Drug Discov 2019;18:139-58.
17. Charache S, Barton FB, Moore RD, et al. Hydroxyurea and sickle cell anemia. Clinical utility of a myelosuppressive “switching” agent. The Multicenter Study of Hydroxyurea in Sickle Cell Anemia. Medicine (Baltimore) 1996;75:300-26.
18. Eaton WA, Bunn HF. Treating sickle cell disease by targeting HbS polymerization. Blood 2017;129:2719-26.
19. Tracewell WG, Trump DL, Vaughan WP, Smith DC, Gwilt PR. Population pharmacokinetics of hydroxyurea in cancer patients. Cancer Chemother Pharmacol 1995;35:417-22.
20. Villani P, Maserati R, Regazzi MB, Giacchino R, Lori F. Pharmacokinetics of hydroxyurea in patients infected with human immunodeficiency virus type I. J Clin Pharmacol 1996;36:117-21.
21. Steinberg MH, Lu ZH, Barton FB, Terrin ML, Charache S, Dover GJ. Fetal hemoglobin in sickle cell anemia: determinants of response to hydroxyurea. Multicenter Study of Hydroxyurea. Blood 1997;89:1078-88.
22. Davies SC, Gilmore A. The role of hydroxyurea in the management of sickle cell disease. Blood Reviews 2003;17:99-109.
23. Zhang D, Xu C, Manwani D, Frenette PS. Neutrophils, platelets, and inflammatory pathways at the nexus of sickle cell disease pathophysiology. Blood 2016;127:801-9.
24. Ansari J, Gavins FNE. Ischemia-Reperfusion Injury in Sickle Cell Disease: From Basics to Therapeutics. Am J Pathol 2019;189:706-18.
25. Steinberg MH, McCarthy WF, Castro O, et al. The risks and benefits of long-term use of hydroxyurea in sickle cell anemia: A 17.5 year follow-up. Am J Hematol 2010;85:403-8.
26. Hankins JS, Aygun B, Nottage K, et al. From infancy to adolescence: fifteen years of continuous treatment with hydroxyurea in sickle cell anemia. Medicine (Baltimore) 2014;93:e215.
27. Charache S, Dover GJ, Moore RD, et al. Hydroxyurea: effects on hemoglobin F production in patients with sickle cell anemia. Blood 1992;79:2555-65.
28. Zimmerman SA, Schultz WH, Davis JS, et al. Sustained long-term hematologic efficacy of hydroxyurea at maximum tolerated dose in children with sickle cell disease. Blood 2004;103:2039-45.
29. Estepp JH, Smeltzer MP, Kang G, et al. A clinically meaningful fetal hemoglobin threshold for children with sickle cell anemia during hydroxyurea therapy. Am J Hematol 2017;92:1333-9.
30. Estepp JH, Winter B, Johnson M, Smeltzer MP, Howard SC, Hankins JS. Improved hydroxyurea effect with the use of text messaging in children with sickle cell anemia. Pediatr Blood Cancer 2014;61:2031-6.
31. Charache S, Terrin ML, Moore RD, et al. Effect of hydroxyurea on the frequency of painful crises in sickle cell anemia. Investigators of the Multicenter Study of Hydroxyurea in Sickle Cell Anemia. N Engl J Med 1995;332:1317-22.
32. Ware RE, Despotovic JM, Mortier NA, et al. Pharmacokinetics, pharmacodynamics, and pharmacogenetics of hydroxyurea treatment for children with sickle cell anemia. Blood 2011;118:4985-91.
33. Paule I, Sassi H, Habibi A, et al. Population pharmacokinetics and pharmacodynamics of hydroxyurea in sickle cell anemia patients, a basis for optimizing the dosing regimen. Orphanet J Rare Dis 2011;6:30.
34. Wiczling P, Liem RI, Panepinto JA, et al. Population pharmacokinetics of hydroxyurea for children and adolescents with sickle cell disease. J Clin Pharmacol 2014;54:1016-22.
35. Estepp JH, Melloni C, Thornburg CD, et al. Pharmacokinetics and bioequivalence of a liquid formulation of hydroxyurea in children with sickle cell anemia. J Clin Pharmacol 2016;56:298-306.
36. Thornburg CD, Calatroni A, Telen M, Kemper AR. Adherence to hydroxyurea therapy in children with sickle cell anemia. J Pediatr 2010;156:415-9.
37. Brandow AM, Panepinto JA. Hydroxyurea use in sickle cell disease: the battle with low prescription rates, poor patient compliance and fears of toxicities. Expert Rev Hematol 2010;3:255-60.
38. Walker AL, Franke RM, Sparreboom A, Ware RE. Transcellular movement of hydroxyurea is mediated by specific solute carrier transporters. Exp Hematol 2011;39:446-56.
39. Walker AL, Lancaster CS, Finkelstein D, Ware RE, Sparreboom A. Organic anion transporting polypeptide 1B transporters modulate hydroxyurea pharmacokinetics. Am J Physiol Cell Physiol 2013;305:C1223-9.
40. Colvin M, Bono VH. The Enzymatic Reduction of Hydroxyurea to Urea by Mouse Liver. Cancer Res 1970;30:1516-9.
41. Andrae U. Evidence for the involvement of cytochrome P-450-dependent monooxygenase(s) in the formation of genotoxic metabolites from N-hydroxyurea. Biochem Biophys Res Commun 1984;118:409-15.
42. Huang J, Kim-Shapiro DB, King SB. Catalase-mediated nitric oxide formation from hydroxyurea. J Med Chem 2004;47:3495-501.
43. Cokic VP, Smith RD, Beleslin-Cokic BB, et al. Hydroxyurea induces fetal hemoglobin by the nitric oxide-dependent activation of soluble guanylyl cyclase. J Clin Invest 2003;111:231-9.
44. Ikuta T, Ausenda S, Cappellini MD. Mechanism for fetal globin gene expression: role of the soluble guanylate cyclase-cGMP-dependent protein kinase pathway. Proc Natl Acad Sci U S A 2001;98:1847-52.
45. Pace BS, Qian XH, Sangerman J, et al. p38 MAP kinase activation mediates γ-globin gene induction in erythroid progenitors. Exp Hematol 2003;31:1089-96.
46. Strouse JJ, Heeney MM. Hydroxyurea for the treatment of sickle cell disease: efficacy, barriers, toxicity, and management in children. Pediatr Blood Cancer 2012;59:365-71.
47. Rodriguez GI, Kuhn JG, Weiss GR, et al. A bioavailability and pharmacokinetic study of oral and intravenous hydroxyurea. Blood 1998;91:1533-41.
48. Gwilt PR, Tracewell WG. Pharmacokinetics and pharmacodynamics of hydroxyurea. Clin Pharmacokinet 1998;34:347-58.
49. Fabricius E, Rajewsky F. Determination of hydroxyurea in mammalian tissues and blood. Rev Eur Etud Clin Biol 1971;16:679-83.
50. Adamson RH, Ague SL, Hess SM, Davidson JD. The distribution, excretion and metabolism of hydroxyurea-C14. J Pharmacol Exp Ther 1965;150:322-34.
51. Kovacic P. Hydroxyurea (therapeutics and mechanism): Metabolism, carbamoyl nitroso, nitroxyl, radicals, cell signaling and clinical applications. Med Hypotheses 2011;76:24-31.
52. DiPiro JT. Concepts in clinical pharmacokinetics. ASHP 2010.
53. Mould DR, Upton RN. Basic concepts in population modeling, simulation, and model-based drug development-part 2: introduction to pharmacokinetic modeling methods. CPT Pharmacometrics Syst Pharmacol 2013;2:e38.
54. Dong M, McGann PT, Mizuno T, Ware RE, Vinks AA. Development of a pharmacokinetic-guided dose individualization strategy for hydroxyurea treatment in children with sickle cell anaemia. Br J Clin Pharmacol 2016;81:742-52.
55. McGann PT, Niss O, Dong M, et al. Robust clinical and laboratory response to hydroxyurea using pharmacokinetically guided dosing for young children with sickle cell anemia. Am J Hematol 2019;94:871-9.
56. Dayneka NL, Garg V, Jusko WJ. Comparison of four basic models of indirect pharmacodynamic responses. J Pharmacokinet Biopharm 1993;21:457-78.
57. Ma Q, Wyszynski DF, Farrell JJ, et al. Fetal hemoglobin in sickle cell anemia: genetic determinants of response to hydroxyurea. Pharmacogenomics J 2007;7:386-94.
58. Gladwin MT, Shelhamer JH, Ognibene FP, et al. Nitric oxide donor properties of hydroxyurea in patients with sickle cell disease. Br J Haematol 2002;116:436-44.
59. Nahavandi M, Tavakkoli F, Wyche MQ, Perlin E, Winter WP, Castro O. Nitric oxide and cyclic GMP levels in sickle cell patients receiving hydroxyurea. Br J Haematol 2002;119:855-7.
60. Cokic VP, Andric SA, Stojilkovic SS, Noguchi CT, Schechter AN. Hydroxyurea nitrosylates and activates soluble guanylyl cyclase in human erythroid cells. Blood 2008;111:1117-23.
61. Lou TF, Singh M, Mackie A, Li W, Pace BS. Hydroxyurea generates nitric oxide in human erythroid cells: mechanisms for gamma-globin gene activation. Exp Biol Med (Maywood) 2009;234:1374-82.
62. Mabaera R, West RJ, Conine SJ, et al. A cell stress signaling model of fetal hemoglobin induction: what doesn’t kill red blood cells may make them stronger. Exp Hematol 2008;36:1057-72.
63. Witt O, Monkemeyer S, Rönndahl G, et al. Induction of fetal hemoglobin expression by the histone deacetylase inhibitor apicidin. Blood 2003;101:2001-7.
64. Ramakrishnan V, Pace BS. Regulation of γ-globin gene expression involves signaling through the p38 MAPK/CREB1 pathway. Blood Cells Mol Dis 2011;47:12-22.
65. Chou YC, Chen RL, Lai ZS, Song JS, Chao YS, Shen CK. Pharmacological Induction of Human Fetal Globin Gene in Hydroxyurea-Resistant Primary Adult Erythroid Cells. Mol Cell Biol 2015;35:2541-53.
66. Browning DD, Windes ND, Ye RD. Activation of p38 mitogen-activated protein kinase by lipopolysaccharide in human neutrophils requires nitric oxide-dependent cGMP accumulation. J Biol Chem 1999;274:537-42.
67. Browning DD, McShane MP, Marty C, Ye RD. Nitric oxide activation of p38 mitogen-activated protein kinase in 293T fibroblasts requires cGMP-dependent protein kinase. J Biol Chem 2000;275:2811-6.
68. Sankaran VG, Menne TF, Xu J, et al. Human fetal hemoglobin expression is regulated by the developmental stage-specific repressor BCL11A. Science 2008;322:1839-42.
69. Zhou D, Liu K, Sun CW, Pawlik KM, Townes TM. KLF1 regulates BCL11A expression and γ- to β-globin gene switching. Nat Genet 2010;42:742-4.
70. Xu J, Sankaran VG, Ni M, et al. Transcriptional silencing of γ-globin by BCL11A involves long-range interactions and cooperation with SOX6. Genes Dev 2010;24:783-98.
71. Grieco AJ, Billett HH, Green NS, Driscoll MC, Bouhassira EE. Variation in Gamma-Globin Expression before and after Induction with Hydroxyurea Associated with BCL11A, KLF1 and TAL1. PLoS One 2015;10:e0129431.
72. Almeida CB, Scheiermann C, Jang JE, et al. Hydroxyurea and a cGMP-amplifying agent have immediate benefits on acute vaso-occlusive events in sickle cell disease mice. Blood 2012;120:2879-88.
Cite This Article
Export citation file: BibTeX | RIS
OAE Style
Pandey A, Estepp JH, Ramkrishna D. Hydroxyurea treatment of sickle cell disease: towards a personalized model-based approach. J Transl Genet Genom 2021;5:22-36. http://dx.doi.org/10.20517/jtgg.2020.45
AMA Style
Pandey A, Estepp JH, Ramkrishna D. Hydroxyurea treatment of sickle cell disease: towards a personalized model-based approach. Journal of Translational Genetics and Genomics. 2021; 5(1): 22-36. http://dx.doi.org/10.20517/jtgg.2020.45
Chicago/Turabian Style
Pandey, Akancha, Jeremie H. Estepp, Doraiswami Ramkrishna. 2021. "Hydroxyurea treatment of sickle cell disease: towards a personalized model-based approach" Journal of Translational Genetics and Genomics. 5, no.1: 22-36. http://dx.doi.org/10.20517/jtgg.2020.45
ACS Style
Pandey, A.; Estepp JH.; Ramkrishna D. Hydroxyurea treatment of sickle cell disease: towards a personalized model-based approach. J. Transl. Genet. Genom. 2021, 5, 22-36. http://dx.doi.org/10.20517/jtgg.2020.45
About This Article
Special Issue
Copyright

Data & Comments
Data


 Cite This Article 68 clicks

 Like This Article 34
likes
Like This Article 34
likes


Comments
Comments must be written in English. Spam, offensive content, impersonation, and private information will not be permitted. If any comment is reported and identified as inappropriate content by OAE staff, the comment will be removed without notice. If you have any queries or need any help, please contact us at support@oaepublish.com.